Acoustic Parameters of Rooms
Room acoustics are arguably the most important factor in the quality of audio reproduction, whether the application is local reinforcement, conferencing, or recording. Audio quality can suffer from poor room acoustics, even when using high-quality microphones, digital signal processors, amplifiers, and loudspeakers that are properly installed and optimally configured. Knowledge of these acoustic parameters plays a key role in correcting poor room acoustics. This article outlines the various measurements and calculations used to describe the acoustic properties of rooms.
Global and spectrum values
Many acoustic measurements can be represented as a global value or as a spectrum. A room may have a background noise level of 45 dBA — this is a global value. This value can be useful for quickly capturing approximate acoustic properties of a room, such as during a site survey or when advanced measurement equipment is not available.
However, global values do not always tell the whole story. For example, a conference room on the top floor of a building directly beneath a roof-mounted AC unit may experience noise focused around a specific frequency range, such as tonal noise from a fan motor or low-frequency vibrations through the building's structural components. In these instances, it is preferred to capture a spectrum of the background noise for a more complete picture.
Spectrum measurements are most commonly captured in octave or 1/3 octave bands, but modern acoustic analyzers and software can often capture detail up to 1/24 octave bands or more. Below is an example of background noise measurements in a room, recorded in octave bands - 125, 250, 500, 1000, 2000, and 4000 Hz.

While the global background noise of the space is 54.1 dB, the level at 4000 Hz is significantly lower than the level at 125 Hz. The latter is useful information that the global value does not tell us, because we now know that softening the room with drapes or acoustic panels may not be the correct solution for the noise problem. Those would be a solution for treating mid to high frequencies, not low frequencies. It may require a more complex solution, such as spring isolators on machinery, silencers for HVAC ducts, or even structural modifications to isolate vibrations.
Global dB values are calculated using the formula 10*LOG(SUM of the antilogs of each value). The antilog is calculated with the formula 10^(x/10). For example:
10*LOG((10^(53.1/10))+(10^(46.4/10))+(10^(36.8/10))+(10^(29.3/10))+(10^(27.4/10))+(10^(25.4/10))) = 54.1 dB
This calculation is also useful when capturing multiple measurements of a room at different locations. The acoustic parameters of a room can vary significantly at different locations throughout the space, so it is advisable to capture as many measurements as possible. This will not only help determine specific areas of the room where more, less, or different acoustic treatment may be required, but also increase the accuracy of global values.
As another example, here is a calculation of the global value of all the background noise measurements taken at 125 Hz. Note that in this case, we divide by 4 for the average of the 4 measurements. This is because they represent measurements taken at different points in time, rather than frequency-specific measurements that make up a full spectrum as calculated above.
10*LOG(((10^(52.8/10))+(10^(54.9/10))+(10^(53.0/10))+(10^(50.8/10)))/4) = 53.1 dB
Background noise
One of the most critical acoustic parameters of a room is the background noise level. This is sometimes called the noise floor. This noise may include ambient noise from environmental controls, equipment in the room, or noise from outside of the room. While the most common source of noise is the building's HVAC, computers and A/V equipment with fans, street noise from outdoors, and people outside the room are all noise sources that can negatively impact the performance of the room for its intended purpose. The difference between the measured noise floor in the room and the level of the talker at the microphone is referred to as the signal-to-noise ratio (SNR). This ratio must be at least 10dB, but should be closer to 25dB for optimal speech intelligibility. The recommended maximum noise floor for small conference spaces is between 35-40dBA (A-weighted sound level measurement). This level corresponds with the Noise Criterion (NC) curve of 25-30.
Reverberation time
RT60
RT60 is a measurement of the time in seconds for acoustic energy to decay (decrease) by 60dB in a specified frequency range. Rooms are sometimes referred to as “live” (long RT60) or “dead” (short RT60). The ideal RT60 depends on the purpose of the space as well as its size and other physical properties.
Shorter RT60 times generally equal better speech intelligibility. A typical small conference room or classroom should have an RT60 of around 0.4 to 0.6 seconds. But the lowest possible RT60 is not always desirable, particularly in larger rooms. Lecture halls, courtrooms, and other medium to large presentation spaces can benefit from slightly longer RT60 times. This prevents sound from decaying too quickly to be heard by listeners in the back rows, farthest from the talker. If musical performance is the primary purpose of the space, longer RT60 times can be desirable to increase the perceived loudness and presence of the performance by listeners.
The desired RT60 may also depend on whether or not a sound system exists in the space. A lecture hall with loudspeakers distributed across each row close to the listeners may benefit from a shorter RT60 more than one with no sound system that relies on the natural reverberance of the space.
Below are the typical target RT60 times for various room types:
| Room Type | Recommended RT60 |
|---|---|
| Recording studio | 0.3 s (300 ms) |
| Conference room, classroom | 0.4 - 0.6 s (400 - 600 ms) |
| Lecture hall, courtroom | 1.0 - 1.5 s (1000 - 1500 ms) |
| Concert hall | 1.4 - 2.0 s (1400 - 2000 ms) |
| House of worship | 2.0 - 10 s (2000 - 10,000 ms) |
EDT, T20, T30
While RT60 is the most commonly known metric for reverberation time, there are several other variants. Accurately measuring RT60 requires the test noise or impulse to be 60dB louder than the background noise. If the background noise is 45dBA, it would require test noise of 105dBA - loud enough to require hearing protection and probably not welcome in an office or school during occupied hours.
Additionally, the RT60 decay curve may not be diffuse, or evenly distributed. In other words, there are usually peaks and valleys in the decay of sound rather than it being perfectly linear. For these reasons, there are the additional measurements Early Decay Time (EDT), T20, and T30 that focus on 10, 20, and 30dB intervals of decay rather than 60dB.
- EDT = 6 * T1 [T1 = decay time from 0 to -10 dB]
- T20 = 3 * T2 [T2 = decay time from -5 to -25 dB]
- T30 = 2 * T3 [T3 = decay time from -5 to -35 dB]

Note that each calculation is adjusted for comparison to RT60. EDT is the amount of time that it takes for sound to decay by 10dB, multiplied by 6. It is therefore possible for the EDT value to be greater than the RT60 value in the same measurement, if sound decays more slowly for the first 10dB compared to the overall 60dB. In most cases, EDT has a greater impact on speech intelligibility than RT60 and is ideally shorter, such as in this example:

As with the background noise example above, reverberation time measurements can be global or frequency-specific. This is another example of how rooms may not be diffuse - reverberation time may be longer or shorter within specific frequency bands.
Below is an example of 17 RT60 measurements of a room at 1/3 octave bands. You can imagine how capturing the RT60, EDT, T20, and T30 at 1/3 octave bands could quickly fill a spreadsheet with hundreds of numbers just to describe the reverberation of a room. One T20 measurement from a smartphone app is a good place to start, but it is by no means a final answer of whether a room meets criteria for its expected acoustic performance.

STI, RASTI, STI-PA
Speech Transmission Index (STI)
Speech Transmission Index (STI) is a value between 0 and 1 that represents the intelligibility of speech in a room, with 0 being completely unintelligible and 1 being perfectly intelligible.
Below are the speech intelligibility ratings based on STI value:
| STI value | Intelligibility |
|---|---|
| 0.00 - 0.30 | Bad |
| 0.30 - 0.45 | Poor |
| 0.45 - 0.60 | Fair |
| 0.60 - 0.75 | Good |
| 0.75 - 1.00 | Excellent |
Calculating STI
The method for calculating STI is based on a modulation transfer function. This is a series of low-frequency modulated test signals designed to simulate human speech played through a source in the room. A measurement microphone captures the resulting signal to determine the apparent signal-to-noise ratio or (S/N)ap of each octave band from 125Hz to 8kHz. The (S/N)ap of each band is then weighted based on its percentage of statistical contribution to intelligibility.
(S/N)ap = 0.01*(S/N)ap,125Hz + 0.042*(S/N)ap,250Hz + 0.129*(S/N)ap,500Hz + 0.2*(S/N)ap,1kHz + 0.312*(S/N)ap,2kHz + 0.25*(S/N)ap,4kHz + 0.057*(S/N)ap,8kHz
STI = ((S/N)ap + 15) / 30
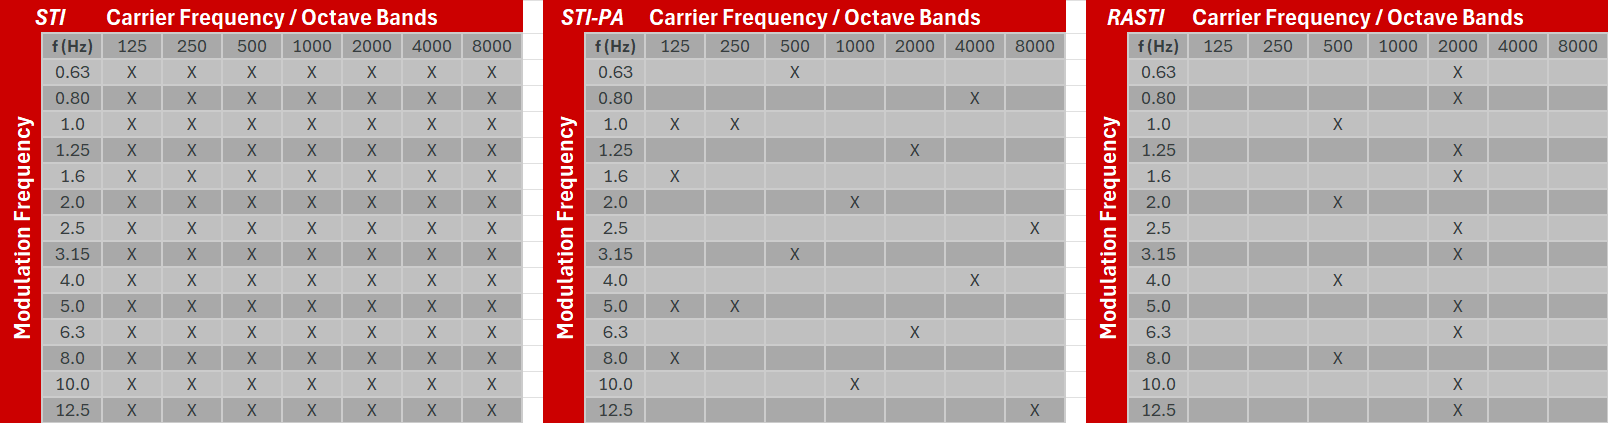
Rapid Speech Transmission Index (RASTI)
Given that the standard STI method requires approximately 65 seconds per single measurement, measuring large acoustic spaces with multiple test points can be a time-consuming task. The RASTI method has been engineered to attain results in approximately 10 seconds, a notable improvement in efficiency. However, this approach is accompanied by a compromise in precision, as it employs a mere two octave bands (500 Hz, 2 kHz) rather than the seven bands utilized in the traditional method.
Speech Transmission Index for Public Address (STI-PA)
The STI-PA (STIPA) method is the most widely adopted approach to measure speech intelligibility of public address speaker systems, as specified in DIN/IEC 60268-16. STIPA was purposely designed to combine the benefits of both previous measurement methods: It is almost as accurate as STI, while the measurement process is almost as fast as RASTI. This meets the demand of engineers conducting accurate on-site measurements of expansive spaces within a constrained timeframe.
While STIPA covers the same frequency range and 7 octave bands like the full STI method, it uses fewer low-frequency modulation combinations. Although less granular, it remains highly effective for most practical applications. It takes around 13 seconds to complete a single measurement cycle.
Clarity (C50, C80)
Clarity is a dB value that defines the difference between early and late reverberation energy arriving at the listener. Early and late are defined as before and after 50 milliseconds for speech clarity (C50) and 80 milliseconds for musical clarity (C80).
Speech clarity (C50)
Speech clarity can be measured in all octave bands for the most complete information, but the standard global value is calculated based on the 500Hz, 1kHz, 2kHz and 4kHz bands, known as the "speech average." Each octave band is then weighted based on its percentage of statistical contribution to intelligibility, similarly to STI.
C50 (“speech average”) = 0.15*C50,500Hz + 0.25*C50,1kHz + 0.35*C50,2kHz + 0.25*C50,4kHz
Musical clarity (C80)
The calculation for musical clarity is similar to speech clarity, but the average is usually taken of 500, 1kHz, and 2kHz octave bands with equal weighting.
The ideal average clarity is -4 to 1dB.
Gain (G)
Gain (G) is a dB value that defines the difference in sound pressure level from a source and the level of the same source 10 meters away. The average of the 500Hz and 1kHz octave bands is used.
GMid = (G500Hz + G1kHz) / 2
If the room's volume and reverberation time are known, gain can also be estimated based on this data, using either the RT or EDT time in seconds in the 500Hz and 1kHz bands:
GMid = 10*LOG(RTMid / V) + 44.4 [RTMid = (RT500Hz + RT1kHz) / 2]
GMid = 10*LOG(EDTMid / V) + 44 [EDTMid = (EDT500Hz + EDT1kHz) / 2]
V = Volume, m3
The ideal gain for a concert hall is 4.0 to 5.5dB.
Brilliance
Brilliance is a metric that captures the presence of sound in a space. It is achieved with the ideal amount of high-frequency reflections that are not so excessive as to sound too bright or harsh.
Brilliance = (RT602kHz + RT604kHz) / (RT60500Hz + RT601kHz)
The ideal brilliance is a minimum of 0.8.
Bass ratio (warmth)
Bass ratio is a metric describing the relative reverberation time of low frequencies. RT is most typically optimum when slightly longer at low frequencies to achieve the ideal "warmth." However, it should not be so excessive that it sounds "boomy." The ratio is calculated by comparing the average of low to mid frequency octave bands:
BR = (RT60125Hz + RT60250Hz) / (RT60500Hz + RT601kHz)
Ideal BR values:
- Optimal speech intelligibility: 0.9 < BR < 1.0
- Concert hall with RT60 ≤ 1.8 s: 1.1 < BR < 1.45
- Concert hall with RT60 ≥ 1.8 s: 1.1 < BR < 1.25