Equalizing loudspeakers in a sound system
Most audio electronic devices have an almost perfect flat frequency response (20Hz to 20kHz), but this is not the case with electro acoustical devices, like loudspeakers and microphones. Most good manufacturers build their loudspeakers to have a fairly good frequency response, but the sound reaching the listener may not necessarily follow the same response curve. The interaction with the acoustic space and other loudspeakers is what causes this frequency response to change at the listener position.
There are three categories of interaction that will cause the frequency response to change:
- The first is the interaction between speakers. Adding another speaker results in a modified frequency response at virtually all listening positions. This is due to the summation of the two responses arriving at a relative time (phase) and level at each listener position.
- The second category is the interaction of the speaker(s) with the room. Here the response varies with speaker position, depending upon the relative time arrival and level between the direct sound and the sound reflecting of surrounding surfaces. Both of the above effects are the result of a summation in the acoustical space of multiple sources, either speaker and speaker, or speaker and reflection. Therefore the solutions for these interactions are very closely related.
- The third interaction is the position of the listener relative to the speaker. Most speakers do not have the same coverage angle across the entire frequency band and as the listener moves away from the speaker in either the horizontal, vertical or both planes, this frequency response (perceived tone) will change.
So, all in all, the tone perceived by the listener is dependent on the position of their ears in relation to the speaker and reflective surfaces (floor, walls, ceiling, etc.) No two points within a space will sound the same.
Can we solve this problem with equalizing the system? Yes and no. Yes we can reduce the magnitude of the problem by equalizing the signal. But, we cannot defy the laws of physics (acoustics). When used in conjunction with proper speaker positioning, delay and level settings, equalization will result in a far better reproduction of the original signal.
Required tools
Measurement Microphone
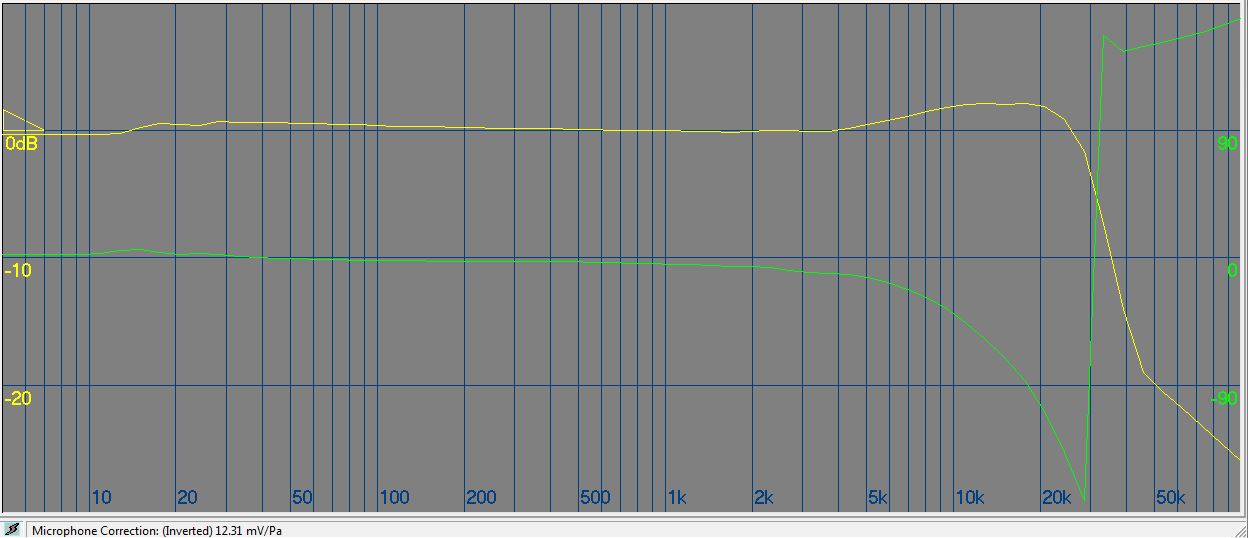
In order to measure the frequency response accurately we need to capture the sound using a microphone that has a ruler flat response. Sadly, even the most expensive microphones have some variations in their frequency response. To overcome this drawback most manufacturers provide calibration data (microphone correction file) that the measuring system will use to correct the measured acoustic frequency response. This data could also contain the microphone's sensitivity, which is used for accurate SPL measurement. Some measuring systems will require you to use a specified microphone, as it would already have the correction data and sensitivity loaded in it. Below is an example measurement microphone's correction response.
Test signal generator
Depending on the post processing required, and the type of analyzer, there are a number of stimulus signals that can be used. Although most measurement systems have an onboard signal generator, some would require the stimulus to be played back from an external signal source.
The signals commonly used in acoustic measurement are:
- Pink noise is a noise that has constant power per octave, per decade, etc. With pink noise, the octave between 20 Hz and 40 Hz would contain the same noise power as the octave between 10,000 Hz and 20,000 Hz
- Frequency log sweep (AKA Chirp) is a continuous log sine sweep from low frequency to high frequency or vice versa. The sweep time and energy is kept constant for every octave. The log sweep is useful when measurements are done in a noisy environment.
- Frequency stepped sine sweep. Stepped sine stimulus plays a sine wave at discrete frequencies, step by step, within a frequency range specified by the user.
Analyzer
There are two types of analyzers available that can display the frequency spectrum of the acquired signal:
- RTA also know as real time analyzer. This type displays the frequency response in multiple bands that are evenly spaced and the resolution is determined by the number of bands, ranging from 32 (1/3 octave spacing) to 240 (1/24 octave spacing) bands.
- FFT (Fast Fourier Transform) analyzer uses digital signal processing techniques to analyze a waveform using Fourier transforms to provide an in depth analysis of signal spectrum. FFT analyzers can measure much more than just the frequency response. Dual channel versions are capable of measuring acoustic phase and delay. The measured data can also be post processed for additional acoustic measurement.
Most analyzers (mostly software based) are capable of doing both RTA and FFT based measurements
Digital Signal Processors (DSP)
Once we have looked at the measured signal, we will then need to modify the frequency response of the signal to achieve the desired results and this can be done with the use of equalizers and filters:
- Equalizers
- Parametric- This equalizer (or Bell filter) is the most commonly used type in equalization and this is because of its ability to modify three parameters that can shape the frequency response: the center frequency, the gain, and the bandwidth. The ability to modify all three parameters gives us finer control over the required equalization curve.
- Graphic - This type is a bank of bell shaped filters that covers the entire audio bandwidth. Each filter caters to a fixed range of frequencies (fixed center frequency and bandwidth). The gain of each of these filters can be adjusted to shape the frequency response as required.
- Filters
- Shelving - These filters can be used to reduce or increase signals above (High Shelving) or below (Low Shelving) a set frequency. They are used as common tone controls (bass and treble) found in consumer audio equipment..
- Pass filters - These filters are used to limit the range of frequencies by passing frequencies above (High Pass Filter) or below (Low Pass Filter) a set frequency. A high pass and low pass filter can also be cascaded to pass only a band of frequencies.
The process
Positioning the microphone
Most measurement microphones are omnidirectional, however this may not necessarily be true at the higher frequencies. The physical size of the microphone's diaphragm will results in some high frequency loss as you move off axis. The larger the diaphragm, the more pronounced this high-frequency loss will be.
So given this fact, where and how should I position the microphone?
- At listener position. There could be many listeners spread across the room and in this case we will need to average out multiple readings taken at various positions.
- At listening height. The microphone would require to capture the same frequency response as your ears, so this would be at ear height.
- Pointed in the direction of the listener. Our ears are not omnidirectional across the entire audio range and tend to get directional as frequency increases. And pointing the microphone in the right direction would eliminate errors at the higher frequencies. When measuring ceiling speakers, it's common to tilt the microphone about 30 degrees upwards.
Capturing the frequency response
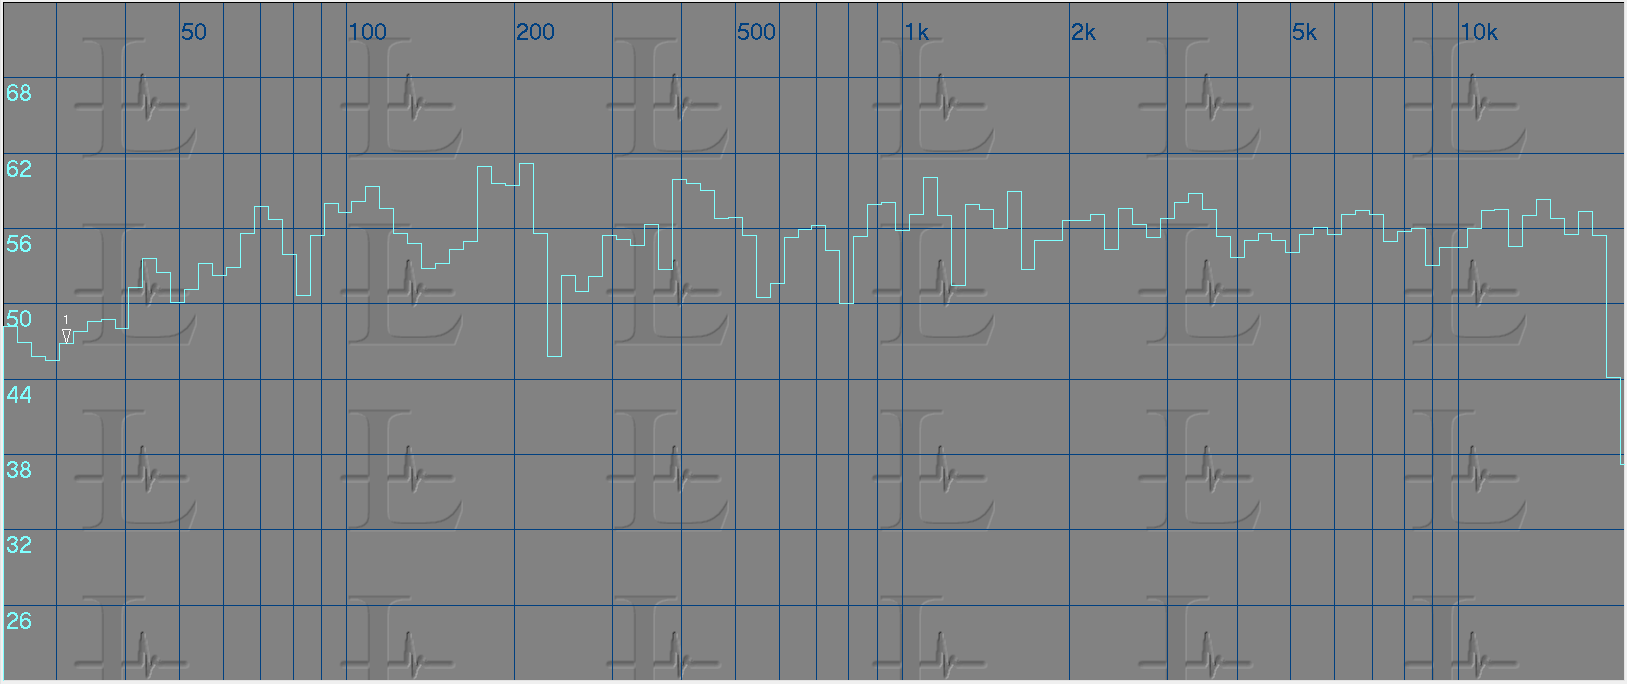
Once we have positioned the microphone, we can wire it up to the analyzer and send the desired stimulus signal to the speakers. The signal picked up by the microphone is then processed by the analyzer to display the frequency response. You can increase the resolution of the frequency response by increasing the number of bands in an RTA or the FFT size in an FFT analyzer.
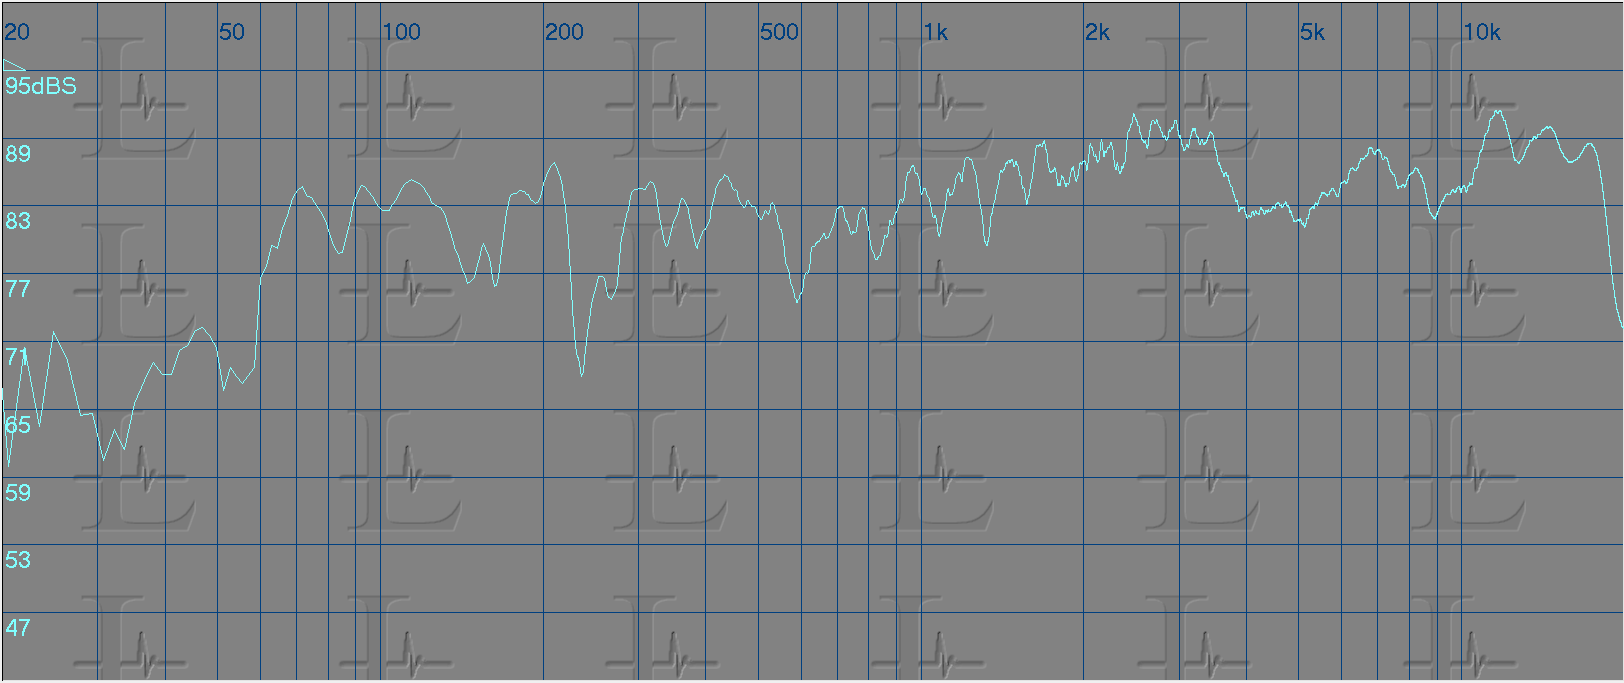
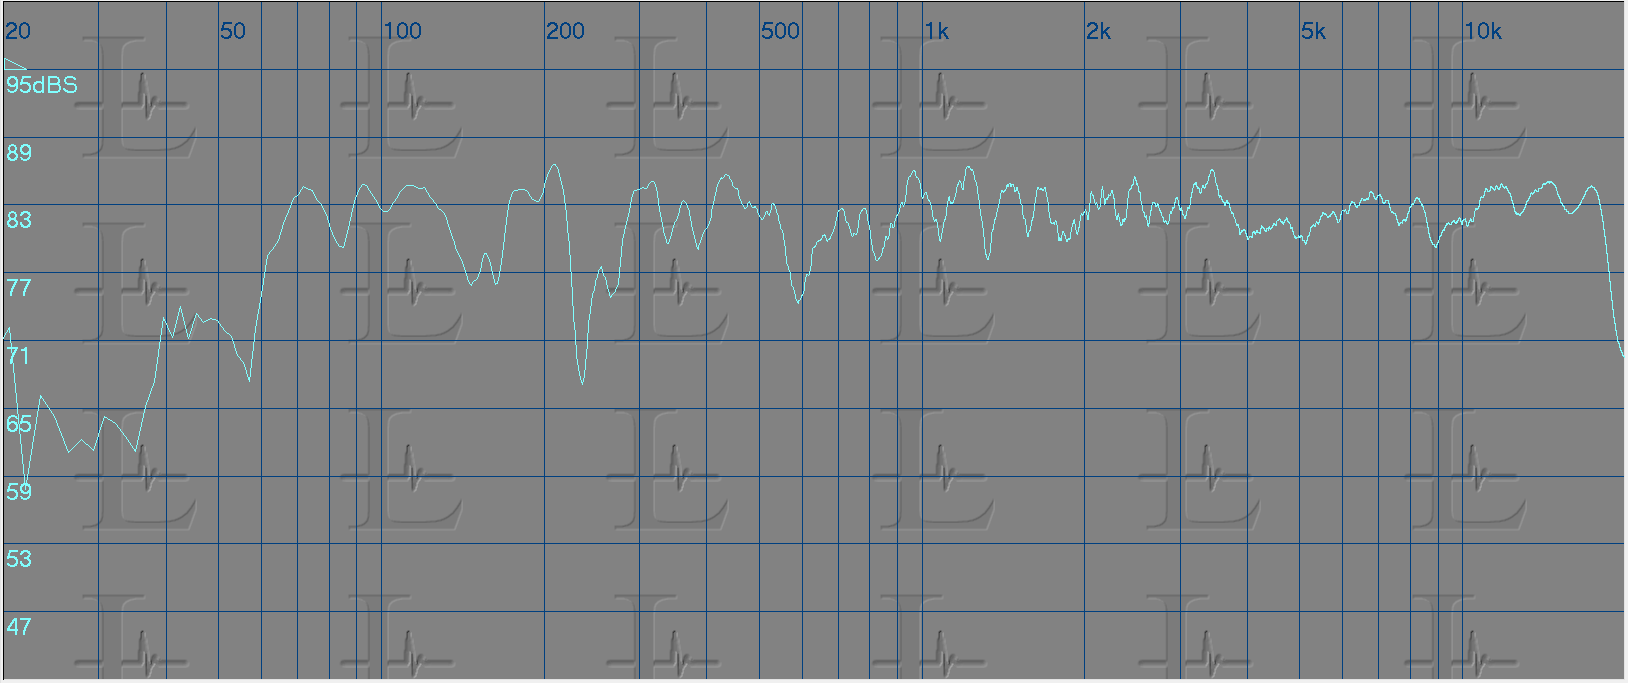
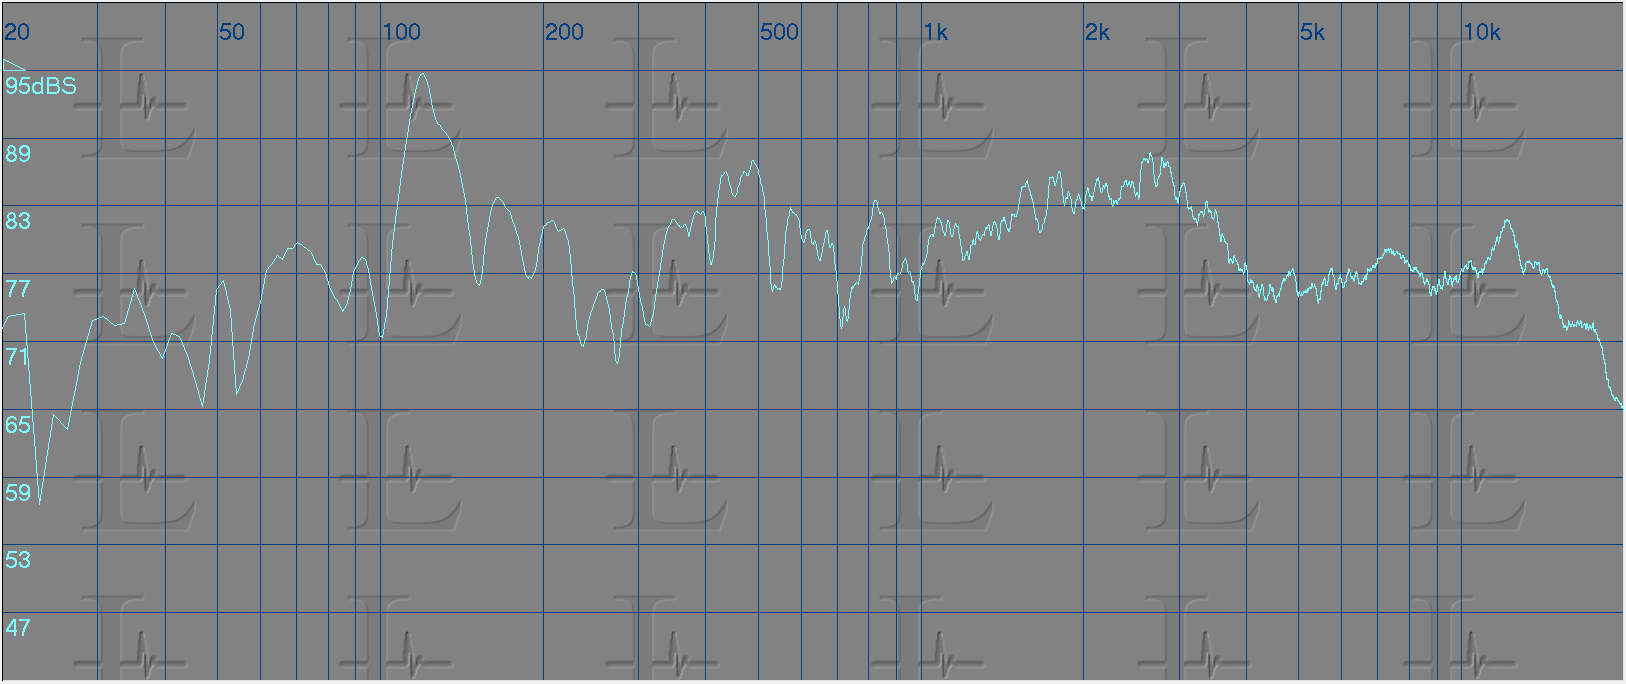
Below are captures of the frequency response of a speaker system using both types of analyzers. The first being FFT and the second RTA. My personal preference is to use a FFT analyzer as it gives me a smother curve rather that a stepped response.
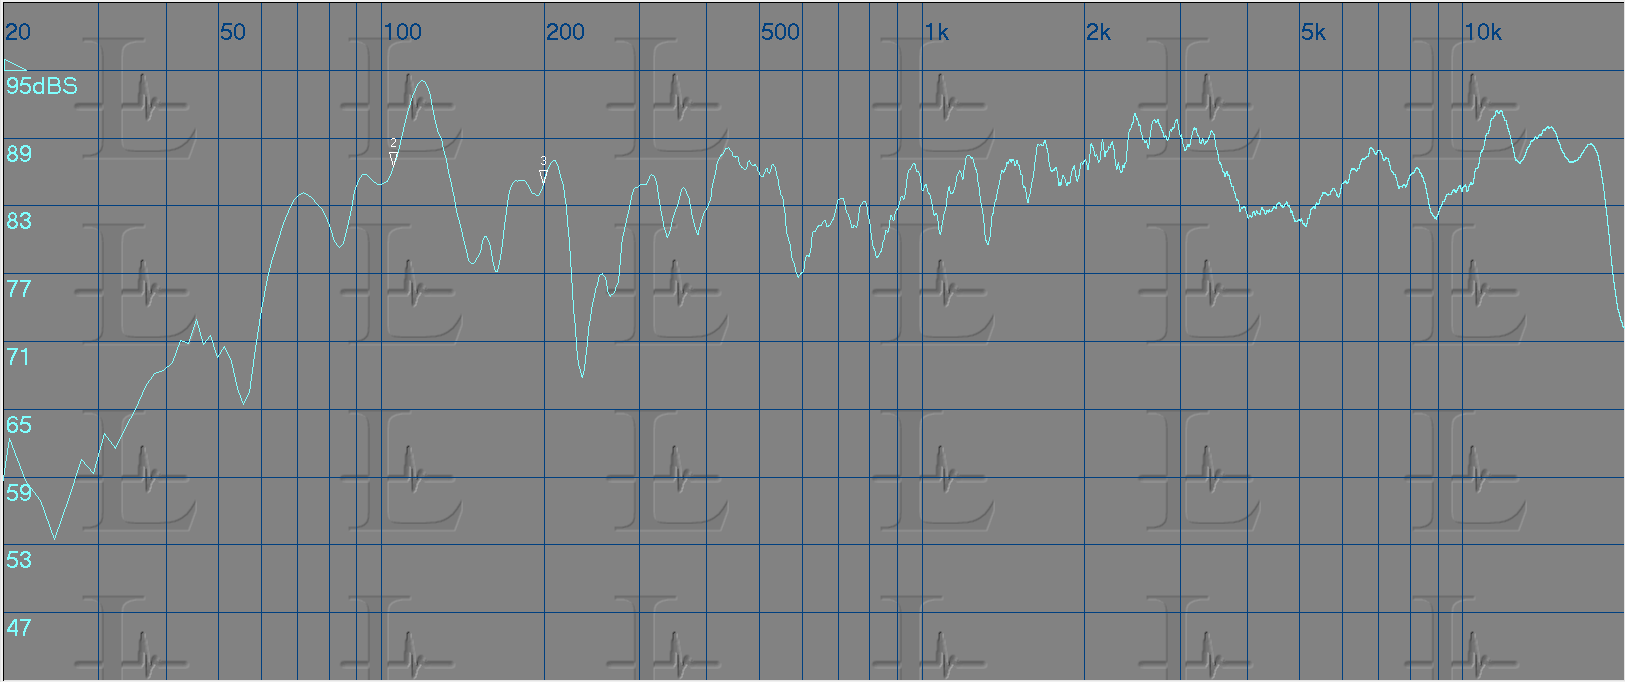

Now that we see the frequency response we need to equalize this curve to a flat line. Practically its not possible to get a flat response, but we can target frequency groups to get close to it. So lets take a look at the measured response and look for problem areas.
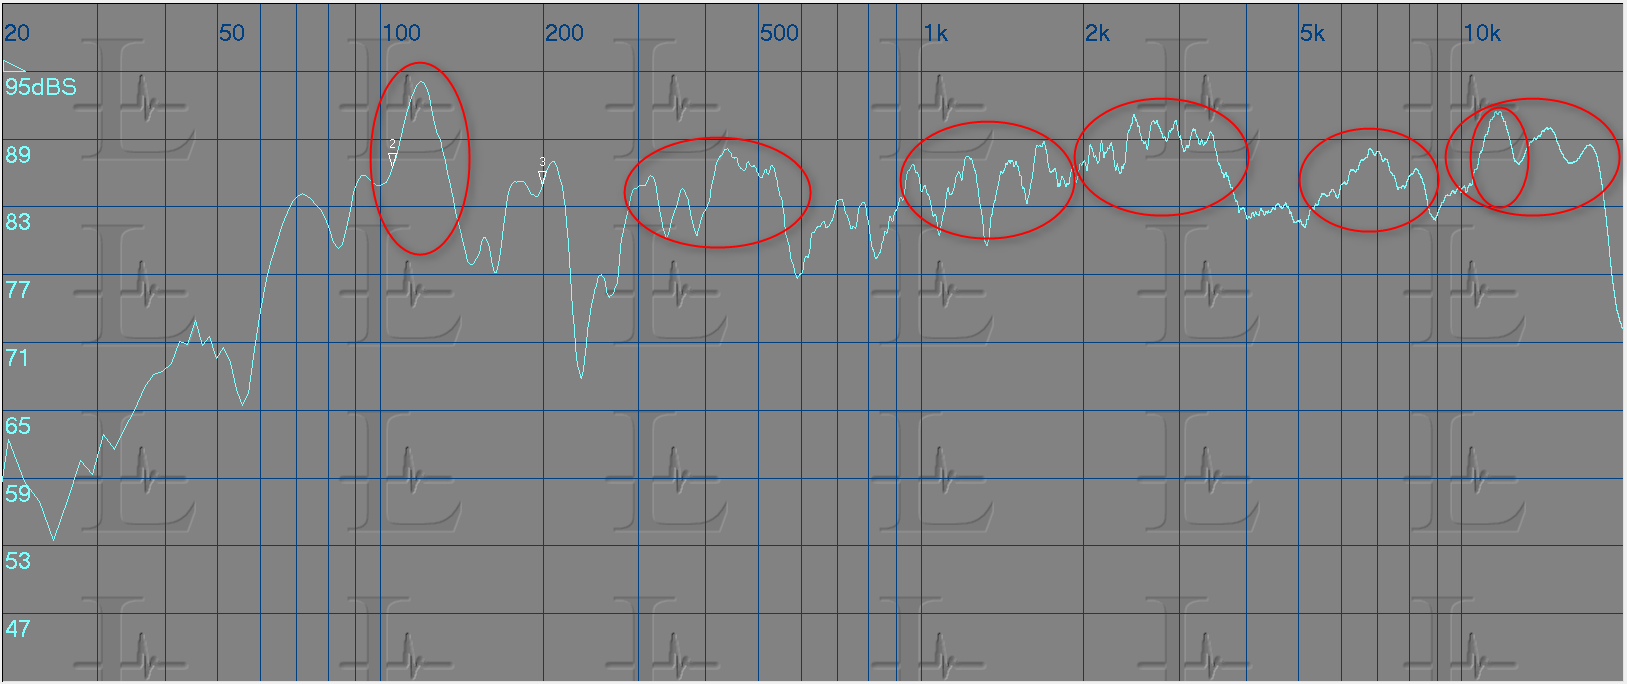
In the above graph you will see that I have marked the problem areas that I felt needed correction. But, how did I reach to this conclusion? Looking at the graph I imagined the response to be a straight line at 83 dB SPL and targeted peaks above that value. But then, you would ask me, why only the peaks and not the valleys? That's because in most cases the valley in the response is due to the the reflected sound in that specific frequency range arriving at a different time (phase) to the direct sound and the acoustic summation of the two results in reduced amplitude in that frequency range. Increasing the amplitude of this frequency range would not improve the response and this is because increasing the direct sound would result in a similar increase in the reflected sound and hence the result would be the same.
-
Equalizing the signal
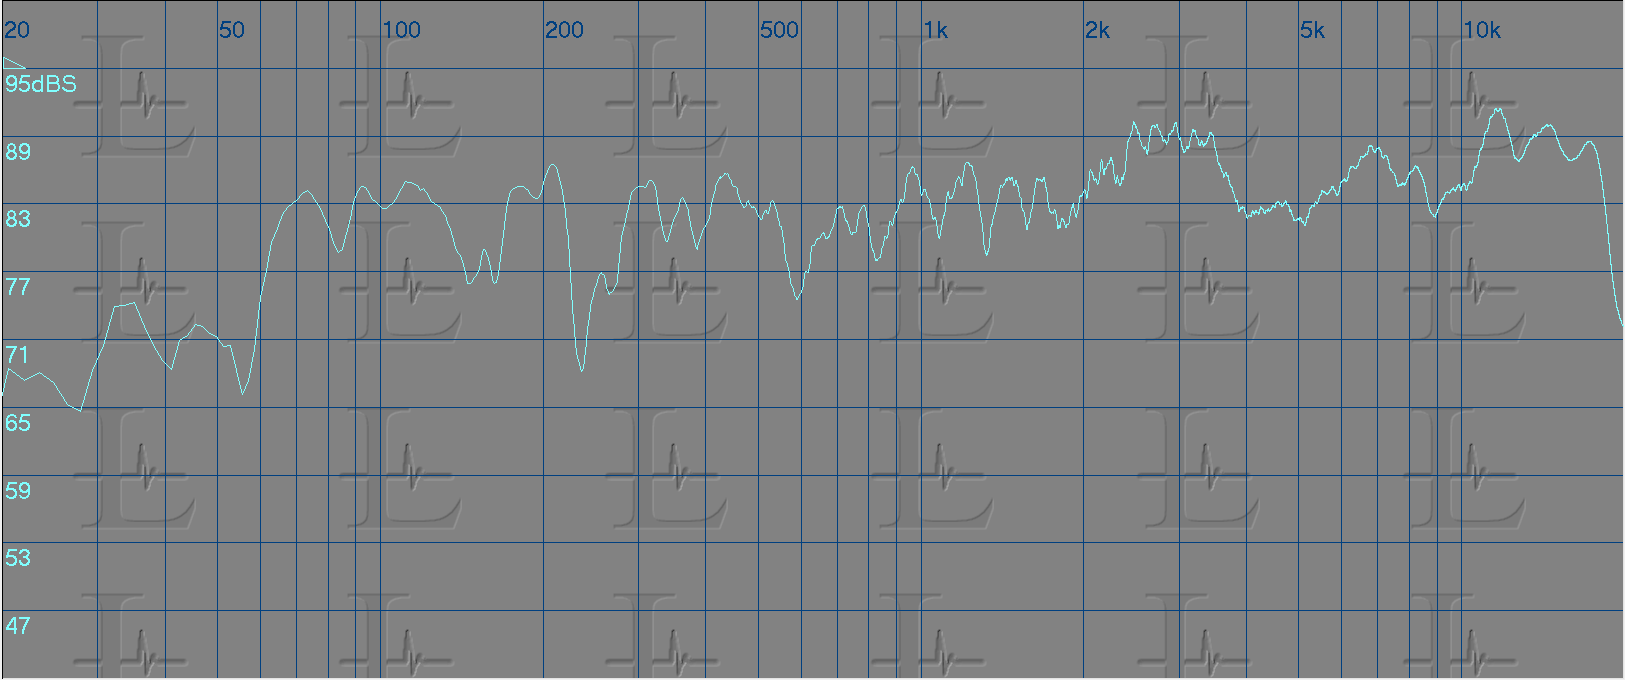
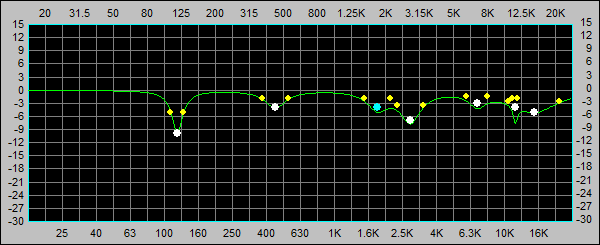
To correct the response I used a parametric equalizer for each of the problem areas marked in the above image and tuned it to the match the curve shape and reversed it by applying a cut to that region. The resultant response for each eq applied is shown below.
The first eq - Center frequency 120Hz, Gain -10dB and Bandwidth 0.250
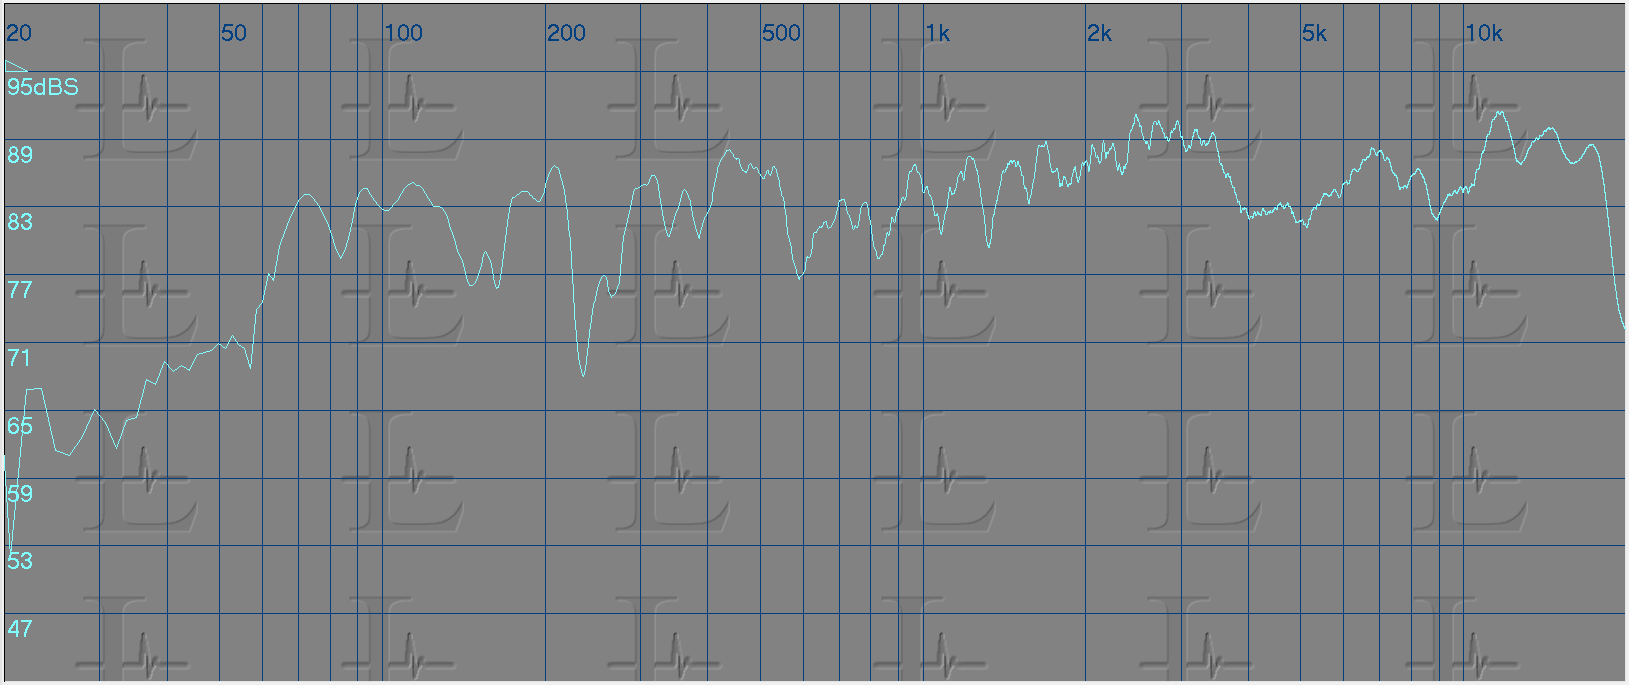
The second eq - Center frequency 450Hz, Gain -4dB and Bandwidth 0.5
The third eq - Center frequency 1800Hz, Gain -4dB and Bandwidth 0.5
The fourth eq - Center frequency 2800Hz, Gain -7dB and Bandwidth 0.5
The fifth eq - Center frequency 6900Hz, Gain -3dB and Bandwidth 0.4
The sixth eq - Center frequency 15000Hz, Gain -5dB and Bandwidth 1

The seventh eq - Center frequency 11600Hz, Gain -4dB and Bandwidth 0.1
i could have avoided using the last eq (7th) as there was no noticeable difference while listening with it on or off and hence would also reduce DSP usage.
Here's the eq curve for all seven bands
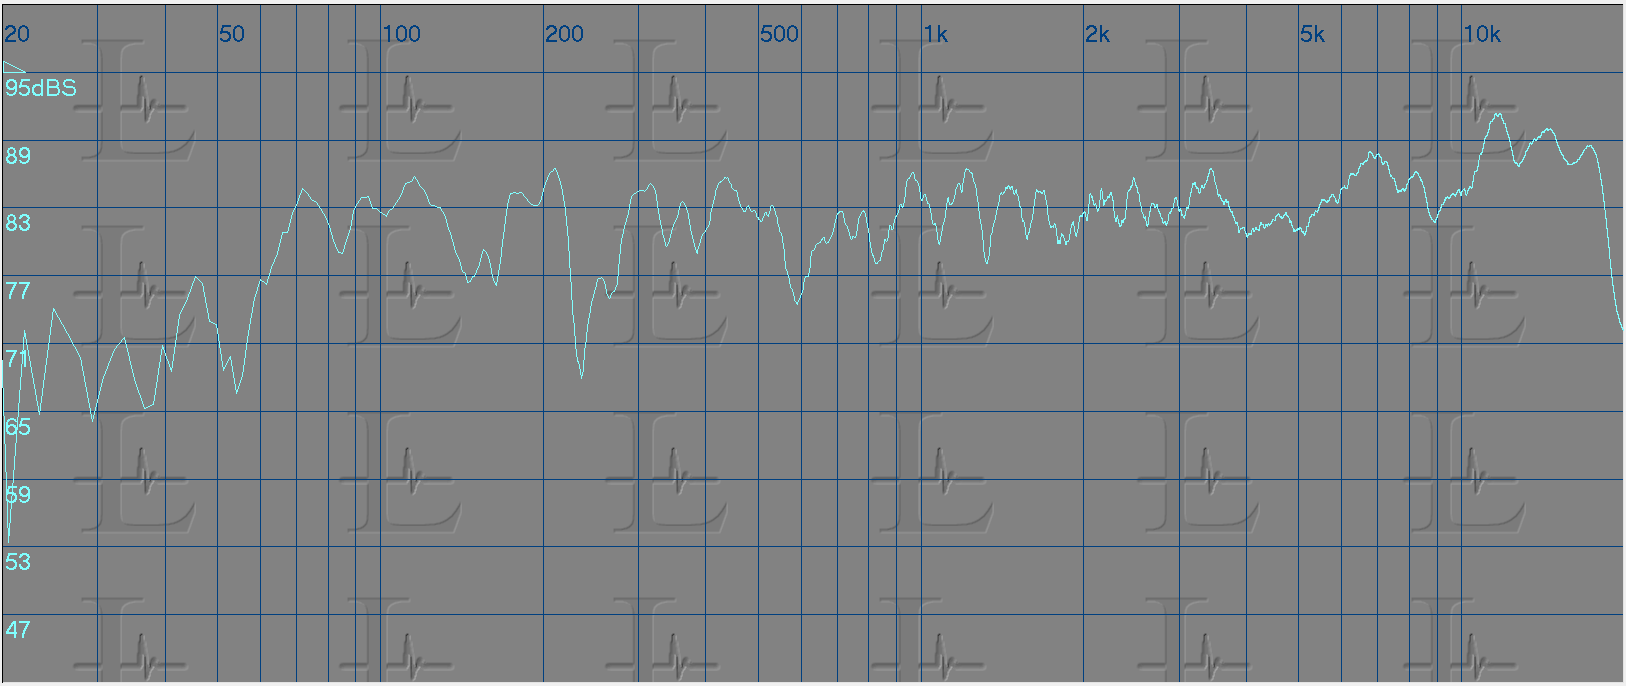
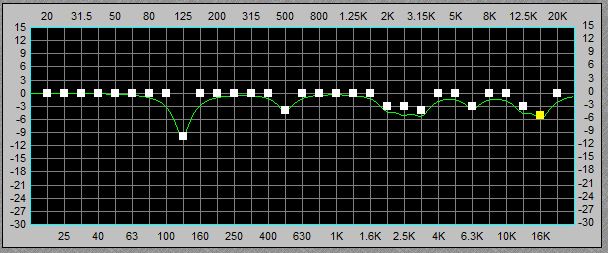
Similarly equalization could be done using a graphic equalizer. And to achieve a similar result I had to use a 31 band GEQ as shown below.
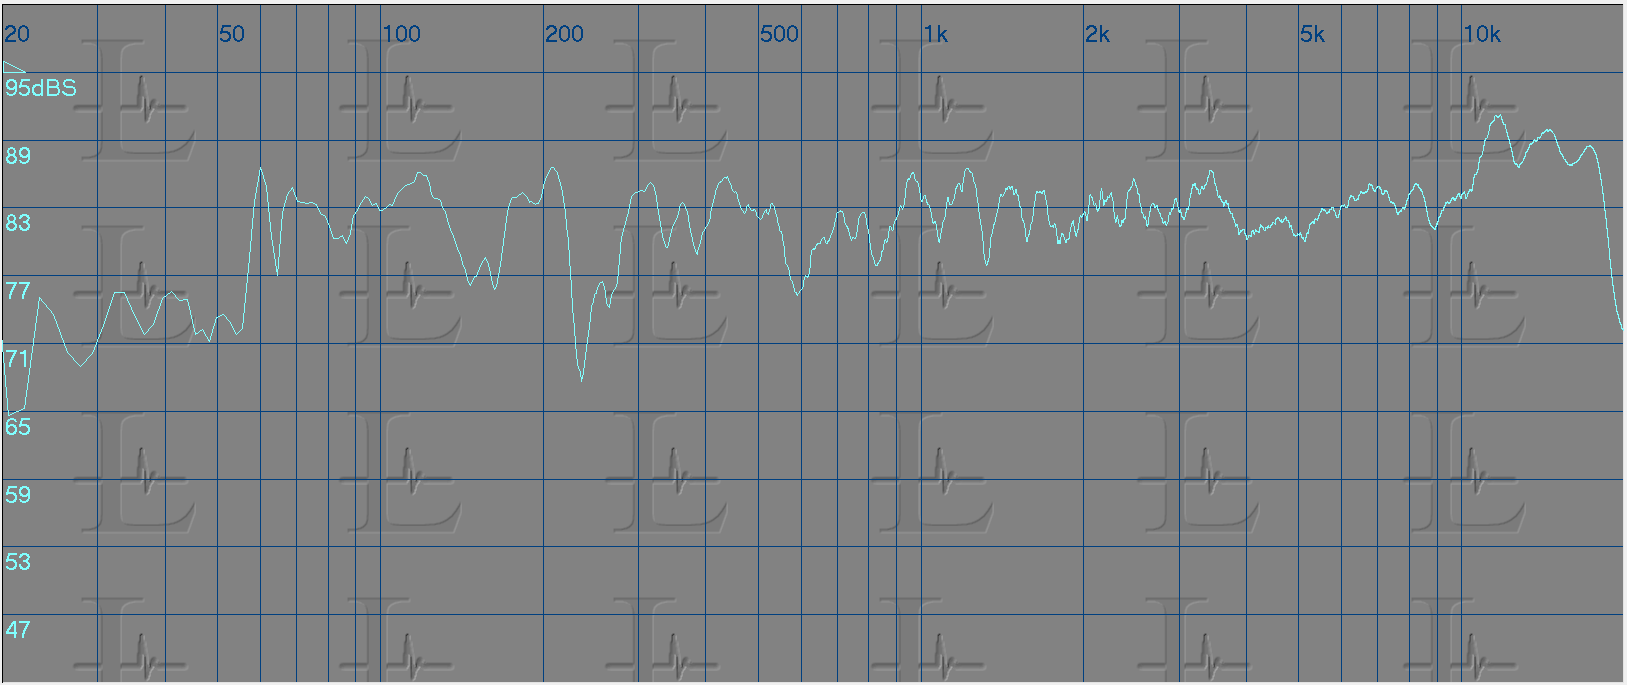
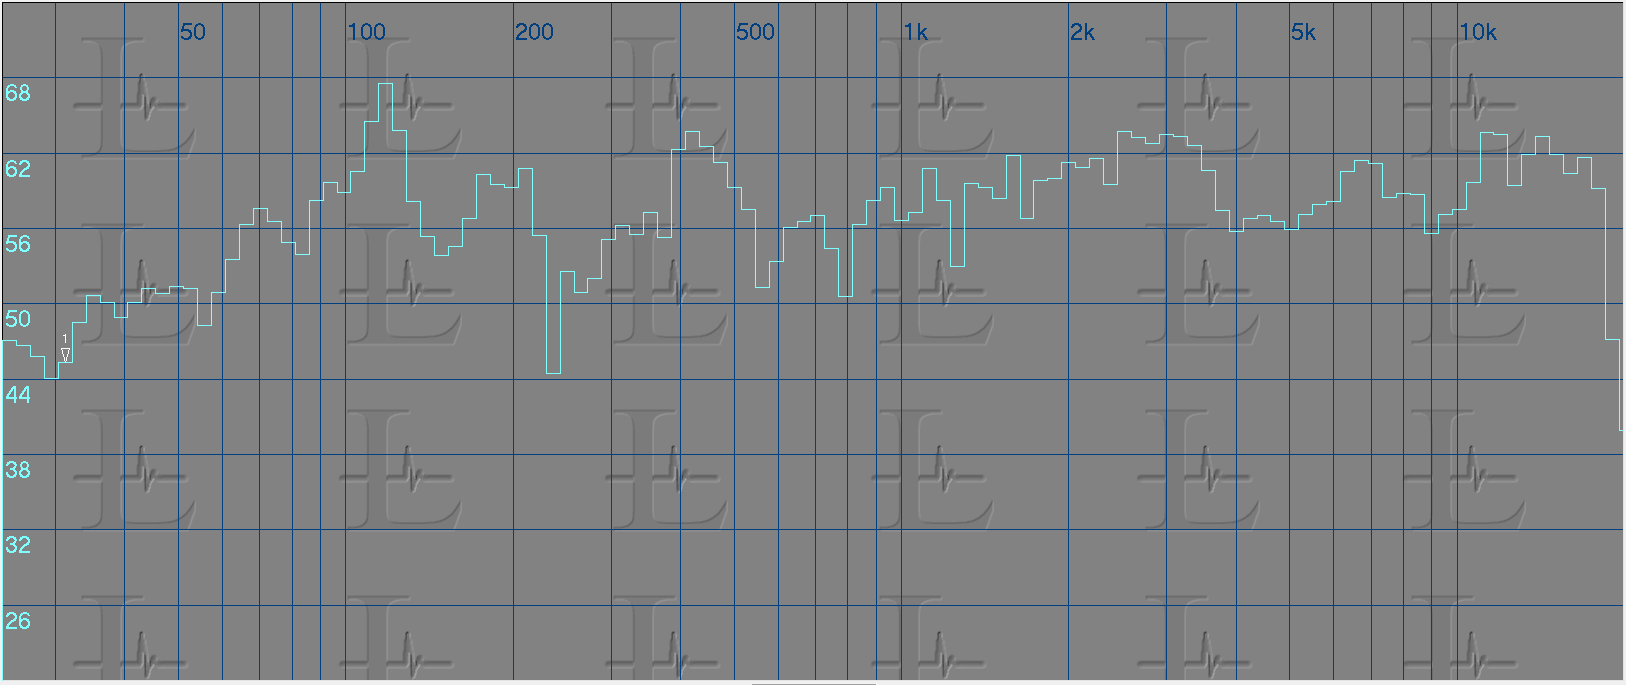
All of the above equalization was done using an FFT based analyzer and below is the same done using an RTA analyzer. The first image the response without equalization and the second is with equalization applied.
There is also a possibility that the speaker may be installed incorrectly, in a way that the listener is off axis to a point where there is a loss in the high frequency response. And this can also be seen because of a poor off axis response of some speakers. Below is an example response of such a case.
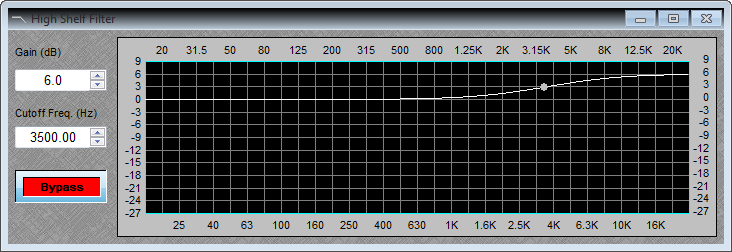
Here you will see a drop in the amplitude for frequencies above 4000Hz and to compensate for this loss you can use a high shelving filter as shown below.
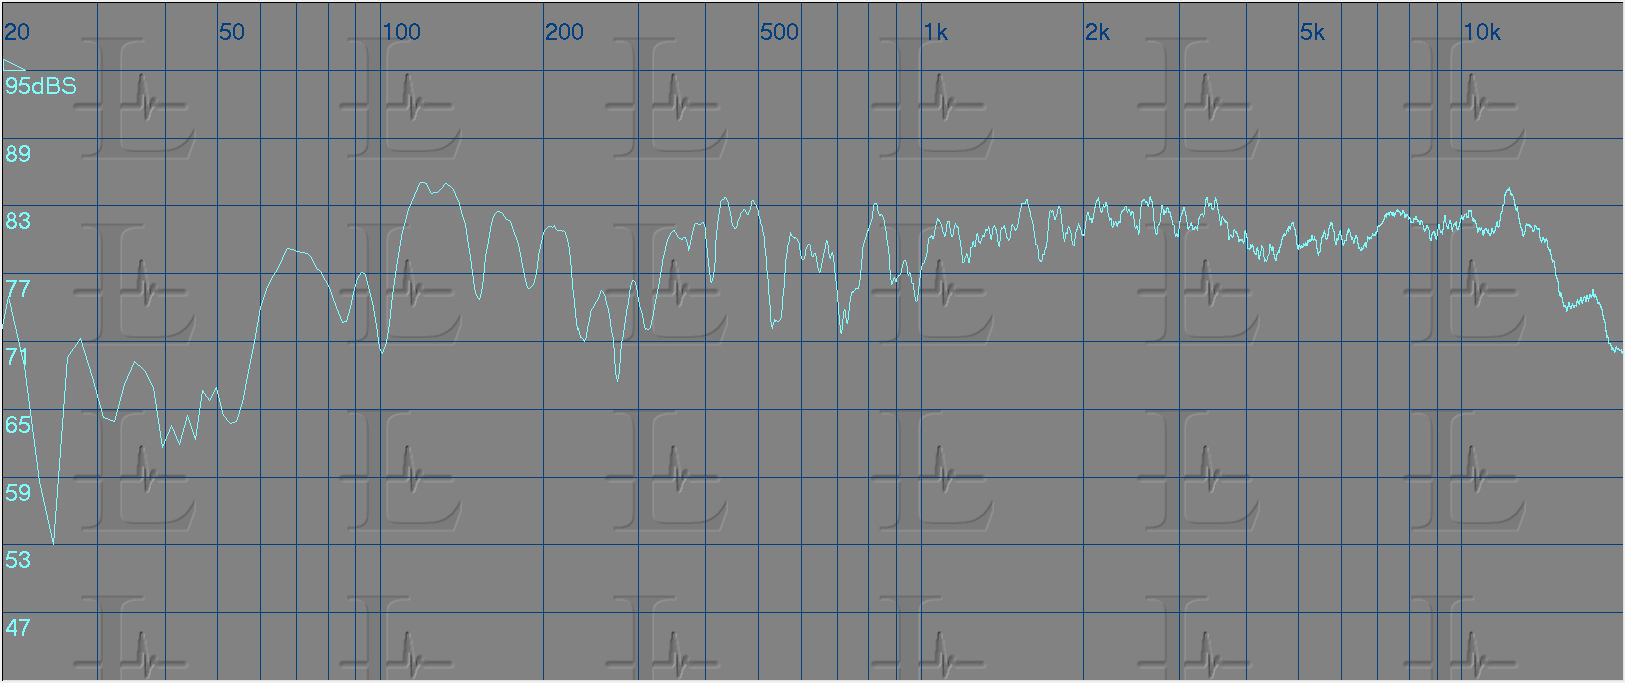
Below is the response after applying the high shelving filter.
Further reading
- http://systune.afmg.eu/
- http://www.rationalacoustics.com/smaart/about-smaart/
- http://www.studiosixdigital.com/audiotools-modules-2/
- https://www.trueaudio.com/rta_abt1.htm
- http://www.nti-audio.com/products/ac...lyzer-al1.aspx
- https://www.roomeqwizard.com/
- https://studiosixdigital.com/
These are links to websites owned and operated by third parties and are provided for your information and convenience only. Biamp Systems does not endorse the products or services of such linked websites or third parties, nor has control over or responsibility for their content or availability.