Formatting FIR Filter coefficient files
The FIR Filter block in Tesira implements a filter that is defined by the FIR coefficients that are loaded into it. FIR coefficients can be stored in either a .wav file format, or a plain-text .csv (comma-separated values) format.
A handy tool for FIR filter design can be found here: http://t-filter.engineerjs.com/ and another here: https://www.arc.id.au/FilterDesign.html
- You can copy the output values from t-filter.engineerjs.com and paste as text into Excel (click in cell, right-click, select "Paste Special...", then select As: Text, and OK) then follow the directions below to format the csv file.
- Output from arc.id.au has the correct comma after the value but you will need to strip the leading and trailing braces.
This article describes how to properly format an Excel file to output a .csv file for Tesira's FIR filter.
Save as .csv file
When you save an Excel spreadsheet as a .csv file, the program will separate values in adjacent cells (horizontally) by commas, and it will separate values in different rows (vertically) with a line feed or line break.
Tesira's FIR Filter block expects all coefficients in the .csv file to be separated by commas, whereas line feeds and line breaks in the .csv file are ignored by Tesira software.
Values arranged horizontally in a single row
If all of your values in Excel are in in the same horizontal row, with 1 unique value per column, then there is no trouble. Each value will automatically get a comma placed between it and the next value. Simply do a Save As file type .csv.
Values arranged vertically in a single column
If your FIR coefficients are arranged in a single column (separate rows, or list-view style) then each value will get a line break, but no comma, after it when the .csv file is created. Tesira will not recognize this formatting.
Excel won’t place a comma after the values in a single column list view unless you add a single quotation mark (‘) in the second column, adjacent to each value in the first column. The easiest way to add a ' (single quotation mark) in all cells of the second column is as follows: put a ' (single quotation mark) in the first cell of the second column; select that cell and all cells below it which are adjacent to your coefficient values in the first column; then "Fill Down" to place the quotation mark alongside all of the coefficient values. You can then Save As file type .csv.
The quotation mark will create a 2nd value in each row, forcing a comma, but there will be no new data added. The line feed is ignored by Tesira and the next coefficient value is read.
If you open the .csv file in a text editor (like Notepad), you can see whether there is a comma after each value or not. If there are no commas, Tesira will not recognize the items as discrete values and will return an error.
Import .csv file
To import the .csv file into Tesira, create a new FIR Filter block in your Tesira file, and choose your .csv file when prompted:
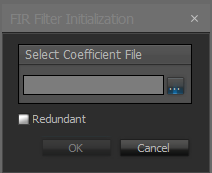
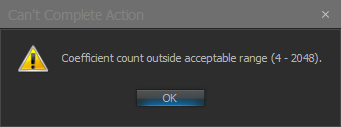
There are a few additional restrictions on FIR coefficient files:
- The FIR coefficient file must contain a minimum of 4 coefficients.
- The FIR coefficient file cannot contain more than 2,048 coefficients.
- Each coefficient must be a decimal number between -1 and 1.
If any of the above conditions are not satisfied, you may see an error when you try to insert the FIR Filter block:

Import .wav file
Tesira allows wav files to be added to the FIR block instead of txt or csv formats. The audio file must be saved as a 48kHz file, either 16-bit or 24-bit, mono or stereo, and a maximum length of 1024 samples (about 0.0213 seconds)
Transfer Function block
Tesira's Transfer Function block will display the effect of the FIR filter on gain and phase of the signal through the block. It will not show the propagation time required to process the FIR filter.
Taps and delay
Delay added in standard delay blocks and FIR filter blocks are not included in Tesira's propagation delay calculations. If the total throughput delay time is desired you must manually add these delay times to the propagation delay reported by Tesira software after compilation (Output Window > System Information tab).
The delay incurred by a FIR filter may be predicted by the software used to create the FIR filter. If multiple FIR filters are used on parallel outputs and time alignment of their respective outputs is critical it is recommended that the FIR filters be designed to all incur the same delay. In this manner the automatic delay equalization provided by Tesira will guarantee synchronous playout of all outputs in a delay EQ group.
Delay incurred by a linear phase FIR filter may be calculated using the formula (taps-1)/sample_rate/2 = time (sec) Multiply the result by 1000 to display time in ms. Replace sample_rate with 48000, the sample rate of the Tesira. Tesira supports FIR filters of up to 2048 taps, which will incur about 21.3ms of delay. Using less taps reduces the delay that is incurred.
FIR filters that are not linear phase can pass audio with minimal delay, the delay cost is dependent on the filter design.
The Transfer Function object supports FIR filters in Tesira SW versions 3.9 and higher. The gain and phase response of the FIR filter will be displayed. Group delay is not shown. The propagation delay feature of the transfer function does not indicate delay incurred by FIR filters or by Delay blocks, rather, it indicates the processing time required for the DSP elements between the 2 selected sample points.
Delay incurred by the FIR filter file can be estimated using the Transfer Function by looking at the frequency where its phase trace wraps across the 0 degree line for the first time (completing 360 degrees of phase shift). Phase is shown on the right-hand side of the graph in the Transfer Function block. The time required for 1 cycle of that frequency is the delay incurred by the filter and can be calculated using 1000 / frequency_of_first_360_degree_shift = delay (ms).
As an example, 1Hz has a cycle that repeats 1 time per second, 10Hz cycles every 1/10th of a second, 100Hz cycles every 1/100th of a second, and 1000Hz cycles every 1/1000th of a second. 1/1000th of a second equals 1 millisecond (1ms). If the phase trace first re-crosses the 0-degree line at 1000Hz then the filter can be seen to incur a 1ms delay. 1000 / 1000Hz = 1ms.
This can be verified using a standard delay block set at 1ms and the transfer function block. The Delays button needs to be active in the Transfer Function to show the phase shift of a Delay block.
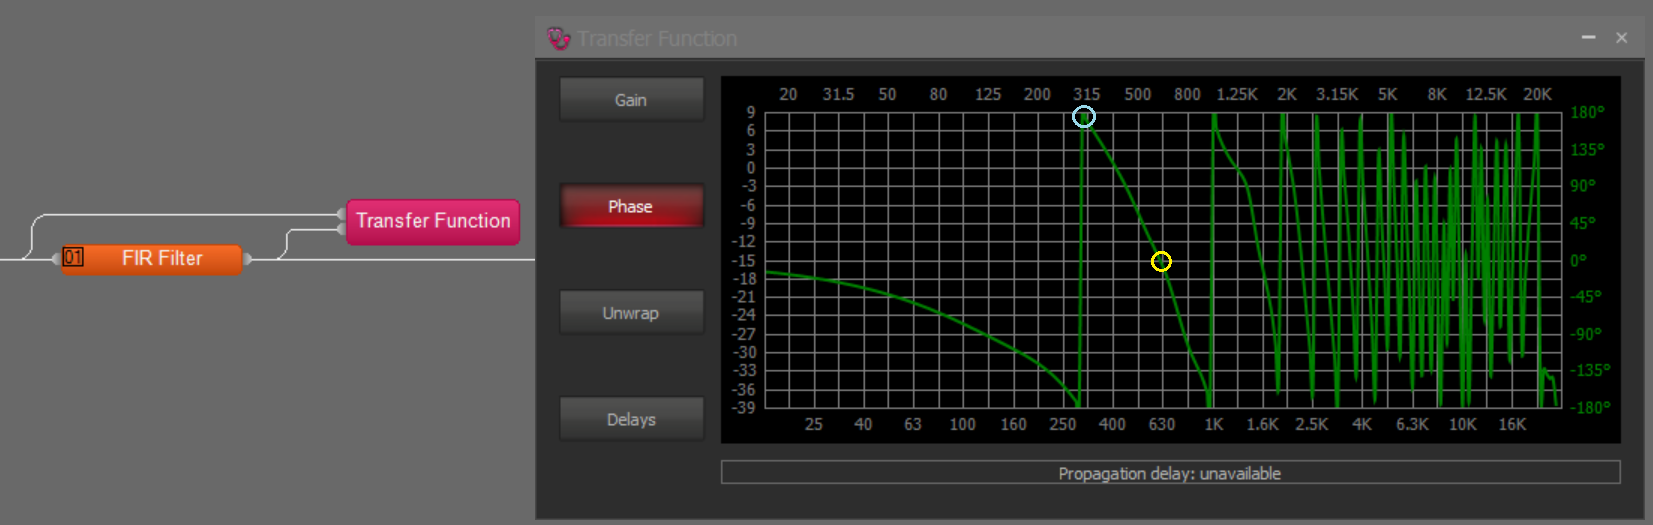
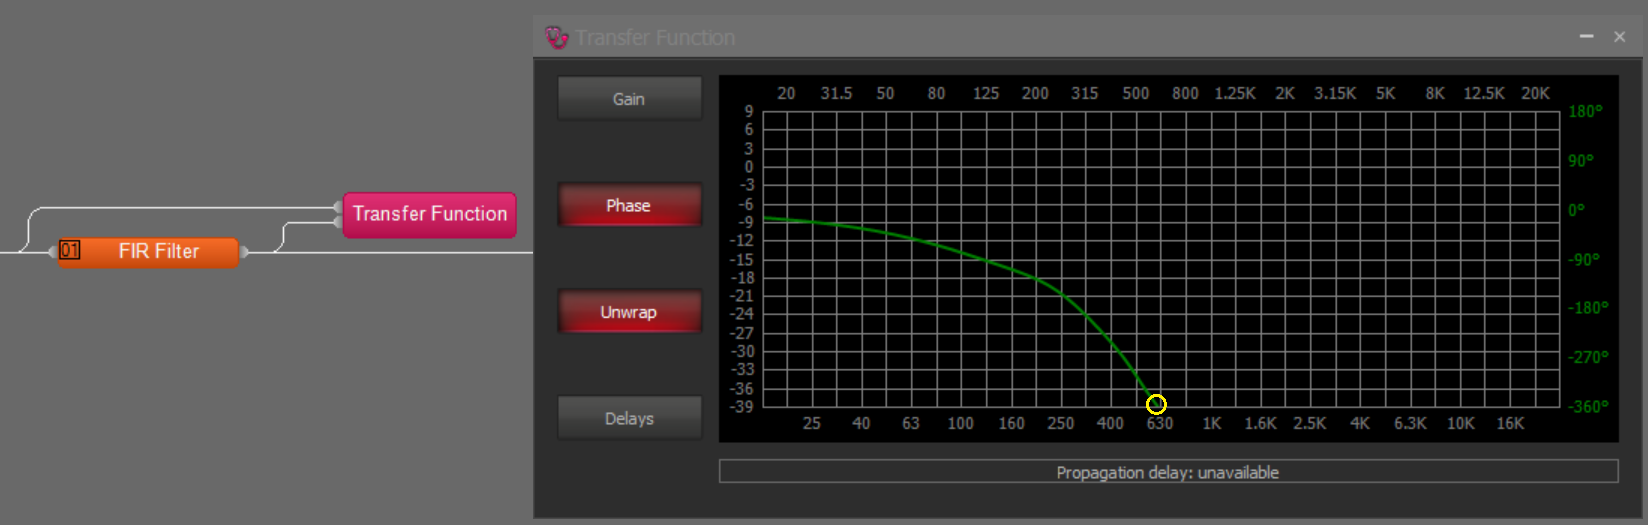
Use the Unwrap feature of the Transfer Function to show the 360-degree crossing on the bottom edge of the graph. This is the same value as the 0-degree crossing shown in the wrapped graph, as 360 degrees equals 1 complete rotation. The unwrapped graph's phase display goes from +180 to -360-degrees.
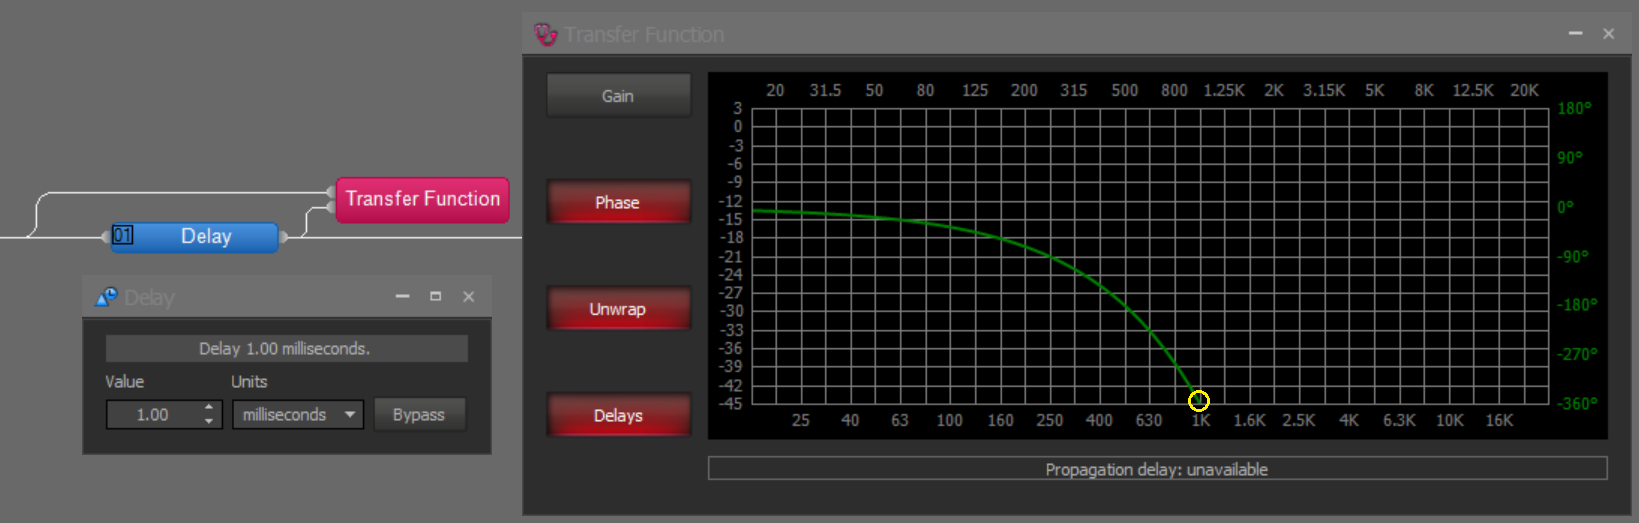
In the wrapped graph, seen below, a yellow circle highlights the same 360-degree crossing at 1000Hz. The scale is +180 to -180-degrees in the wrapped graph. Note the blue circle at the 180-degree crossing at the top of the graph, this frequency is 1/2 of the 360-degree value and can be multiplied by 2 to get the 360-degree frequency. The 180-degree crossing may help to identify the frequencies on the graph, as the logarithmic graph has greater apparent resolution at lower frequencies.
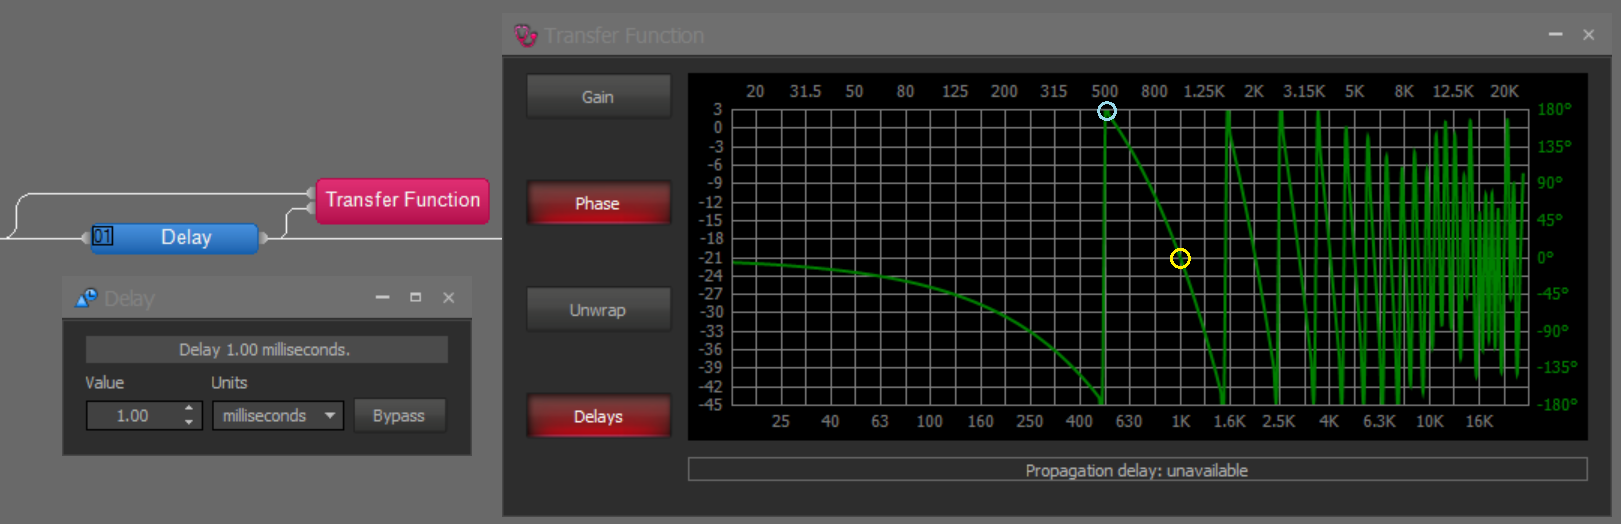
Notice that in both cases the 1ms delay results in a 360-degree phase shift at 1000Hz. Phase shift equals delay.
You can calculate the delay easily using the following formulas:
1000 / frequency_(Hz)_of_first_360-degree_crossing = delay in milliseconds
or
1000 / delay_in_milliseconds = frequency (Hz) of first 360-degree crossing
Here is an example of a FIR filter for a loudspeaker. The Gain is unimportant for determining the delay so is left disabled to clarify the display. In the wrapped trace the 180-degree crossing can be seen to happen at just below 315Hz and the 0-degree crossing is just below 630Hz. This equates to 1000/630 or about 1.58ms of delay due to the FIR filter.
In the unwrapped view the 360-degree crossing is still seen to be at just below 630Hz.
Knowing the delay caused by a FIR filter also allows a rough calculation of the number of taps in the filter using these formulas:
delay_(sec) * 2 * sample_rate = taps
or
(delay_(ms) / 1000) * 2 * sample_rate = taps
These formulas allow you to determine that a filter causing 1.58ms of delay would have approximately 152 taps.
(1.58 / 1000) * 2 * 48000 = 151.68 taps
Frequency Resolution
The frequency resolution of a FIR filter is a function of the sampling_rate / taps = resolution (Hz). For a 2048 tap coefficient file this results in:
48000 / 2048 = 23.4 Hz
If high resolution results are required, and high latency can be tolerated (e.g. - audio playback only), then a high tap count is viable. For many applications lower latencies are required. A combination of a FIR filter with a modest tap count and lower resolution and complementary IIR filters may be the best solution when moderate delay is required.