Biamp Launch custom speaker tuning
In Tesira firmware version 4.2 and later, TesiraFORTÉ X and Devio SCX support user-defined target room EQ curves when using Biamp Launch auto-configuration.
The concept of the room tuning target file is different than simply loading a corrective EQ curve for a speaker. You are specifying what you want the room to sound like, not which correction filters to apply to the speakers. This file defines the target tone that Biamp Launch tuning tries to achieve when tuning the room.
Defining your sound
Biamp Launch tuning uses a default target room tuning which has been tested and determined to yield excellent results in most conference room scenarios. There may be cases where users would prefer a modified tone. The custom room target file offers that solution.
To determine a target tone you wish to employ requires testing and comparative listening tests. An organization may have a particular sonic profile that they prefer to implement. The custom tuning file simplifies this with Launch automation.
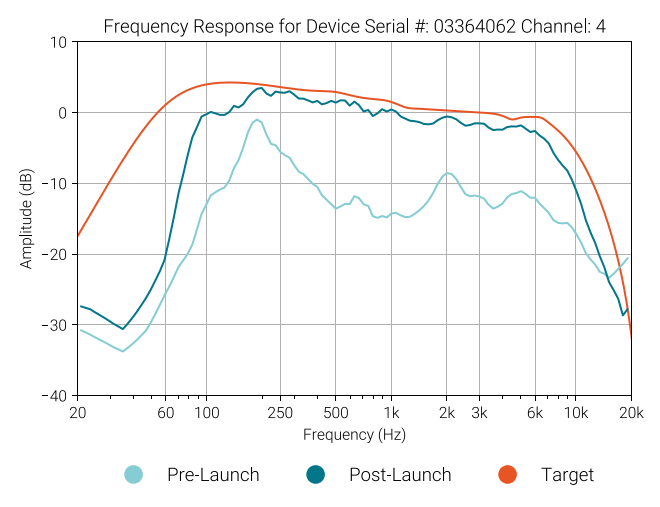
A target value is applied and Launch measures each loudspeaker's response and applies a custom solution to that loudspeaker. The response curve and target SPL match for the room are achieved through a combination of amplitude and EQ adjustments based on measurements taken though the Parle microphones, which are operating in a special omnidirectional tuning mode. Biamp engineers know the precise response behaviors of the Parle mics which allows a high degree of accuracy (and repeatability) when performing room analysis and tuning.
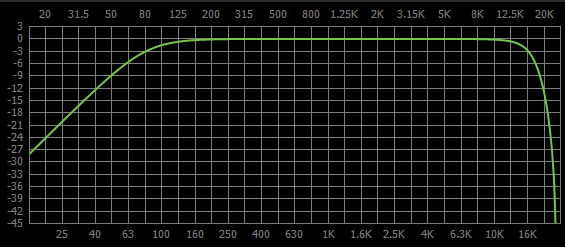
Here is an example of a speaker after Launch auto-tuning has adjusted gain and EQ to attempt to match the target room tuning curve and target SPL. Notice that the low frequency cutoff of the loudspeaker doesn't allow it to match the target below 100Hz, this is a physical property of the loudspeaker's frequency response.
Acoustic measurements can be used to profile the desired sound of a room and a target curve can be defined based on the results.
If there is a room which sounds particularly good then that's a great location to start taking measurements. A room that is difficult to get sounding nice and which poses odd acoustic challenges is not the best choice for refining your target response curve.
How long will it take to get appropriate measurements? This is totally up to you. The first few times it will be a long process, but as you define a workflow and get a feel for what you are trying to see the process will speed up. Once you have defined a target custom room tuning it can be applied again and again and should yield consistent results from room to room.
It is important to remember that a room tuning target is not a guarantee of performance or meeting the target response curve - it is a goal that we try to achieve. Every room is different. Acoustic responses of similarly sized rooms vary widely due to many variables including the materials used in construction, furnishings, the ratio of hard to soft surfaces, HVAC noise, environmental noise, loudspeaker position, mic position, and more.
FFT or RTA?
A dual-channel FFT based measurement system can be used to see the response of a loudspeaker system. A known impulse is played through the loudspeaker system and captured with a test mic. The differences between the impulse source and the captured sound shows what has been added or reduced as the signal passes through signal processing, amplifiers, speakers, and finally the air and room itself. FFT based measurements can show delay through the system, changes in phase, and precise frequency response data throughout the measurement bandwidth and are fairly tolerant of ambient noise if the signal is high enough to be "seen" by the measurement system. Dual-channel FFT based measurements require 2 inputs: a measurement mic or a direct line from a device giving the output of the system under test and a reference signal which provides the original program material to compare against the system's output.
A real-time FFT allows fine resolution measurements which are useful for identifying comb filtering. The real-time FFT may offer too much resolution for the purposes of creating a room tuning profile. The FFT is a Z-weighted measurement.
An RTA is valuable for analyzing the speaker / room response. The RTA offers a smoother response which some feel is better suited for generalized room tuning. An RTA looks at band passed frequency bins which are either 1 octave or 1/3 octave wide. The RTA graphs the acoustic energy present in the room in each bin. It allows for continuous monitoring. The RTA allows considerable insight into the behavior of sound at a given time and location. RTAs offer fast and slow weighting (how many samples are captured and averaged per update of the graph) and also offers acoustic weighting options. The Z-weighted setting is a flat response curve (no filters before drawing the curve), C-weighted measurements attenuate slightly below 100Hz and above 10kHz, and A-weighting uses the most aggressive filtering to mimic the sensitivity of human hearing (low frequency energy begins to roll off below 1kHz and highs roll off above 10kHz). C-weighting is the most common option for room tuning purposes with an RTA.
Whatever measurement method is chosen it is important to understand that the frequency response output graph will show ripples in the response for any one point in the room due to a number of factors including acoustic modes (standing pressure waves), reflections from surfaces in the room, interactions between multiple loudspeakers causing cancellation and summation, variations due to the mics position in the loudspeaker's polar pattern, and more. All of these variables change as the mic position moves so it is generally recommended to sample and average results across a number of measurement positions to get a representative view of the average sound.
Flat response
A 'flat' speaker response curve is often talked about as the ideal target. In practice what this should mean is that the sound coming out of the speakers is the same as the sound being injected into the system, whether it is speech, music, or test tones. If the sound system is artificially adding or removing part of the audio spectrum then it is deviating from a 'flat' response - this can be described as having a cut, or dip, or a boost.
Keep in mind that there are natural low and high boundaries imposed by the loudspeaker's response profile which are hardware based and cannot be artificially extended without overdriving the loudspeaker - for example, a loudspeaker which has a low frequency cutoff at 100Hz will likely be unable to produce high output at 40Hz, and may overexcurt the voice coil if it tries to do so. Adding a custom tuning attempting to impose a large bass boost at 40Hz may result in damage to the speakers.
Test tones
Common test tones can be sine sweeps, pink noise, or white noise. A sine sweep is typically used with an FFT measurement system to analyze the response of a system.
Pink noise is a noise which has equal energy per octave. Pink noise viewed on an RTA should show a fairly constant slope of -3dB/octave. This equates to about a -22dB change from 100Hz to 10kHz, which is fairly easy to see on the RTA. Pink noise is considered to be a fair approximation of what is "nice" to hear.
White noise is noise which has equal energy at all frequencies. White noise on an RTA should show a fairly flat line across the graph. At high levels white noise can damage both high frequency drivers and your hearing.
Music or speech can be used with a dual channel FFT and RTAs to see the real time response of a system. An important distinction is that music or speech may miss regions of interest in the full acoustic energy spectrum versus a sine sweep or shaped noise which provide consistent energy intensity from 20Hz to 20kHz or higher, Music or speech may have a lot of energy content in specific frequencies and be very low in other areas. It is important to consider this when interpreting the results.
Target file parameters
A JSON file can be edited and uploaded for the desired custom tuning target. A template file can be found here: customTargetResponseTemplate.json
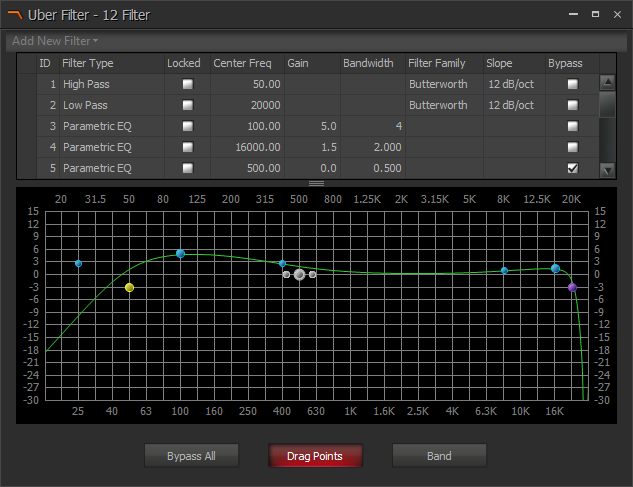
The JSON file allows you to modify the target low corner, high corner, and up to 10 parametric curves. Any of the frequencies, gains, or bandwidths can be changed. Any unused parametric curves can be deleted or left with default values.
Frequencies are adjustable from 20 to 20,000, bandwidth is adjustable from 0.1 to 4.0, gain is adjustable -30 to +15, same as the defaults for our parametric EQ block.
A 12-channel Uber filter in Tesira software can be used to visualize the settings in the JSON file, using 2nd order Butterworth filters for the lower and upper corner settings.
Application
To apply a new custom speaker tuning open the web browser-based user interface (web UI) of the TesiraFORTE X or Devio SCX.
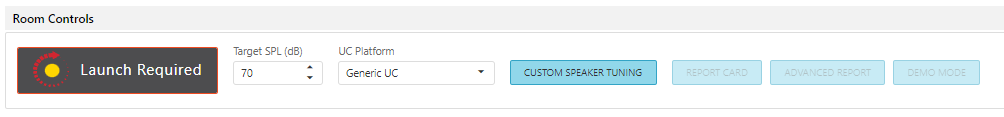
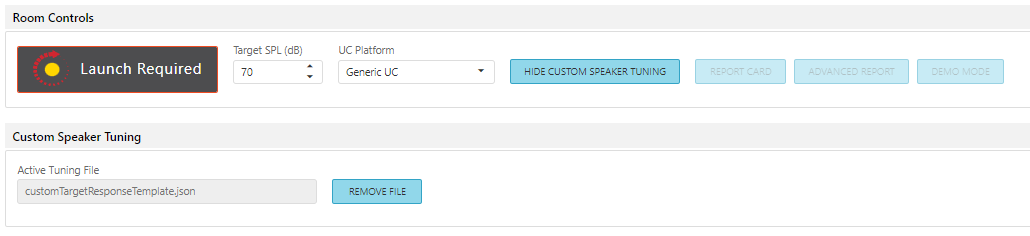
On the Audio webpage, click the Custom Speaker Tuning button in the Room Controls section.
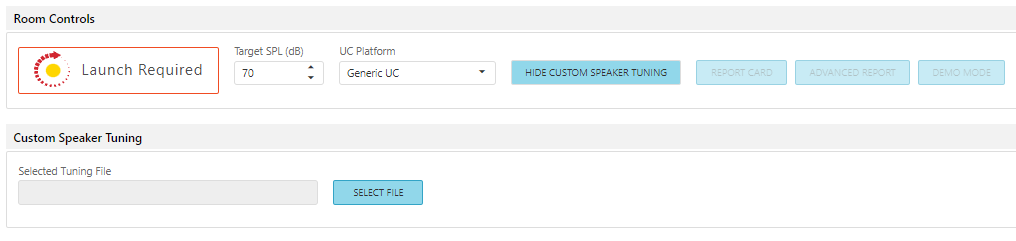
A new Custom Speaker Tuning section will appear.
Click the Select File button and choose a JSON file with the new target curve, then click the Apply button.
Launch configuration must now be run to apply the target settings.
Run Launch using the Launch Required button in the Room Controls section to tune the speakers using the new custom speaker tuning target file.
If a different target curve is desired click the Remove File button and confirm your intent remove the file.
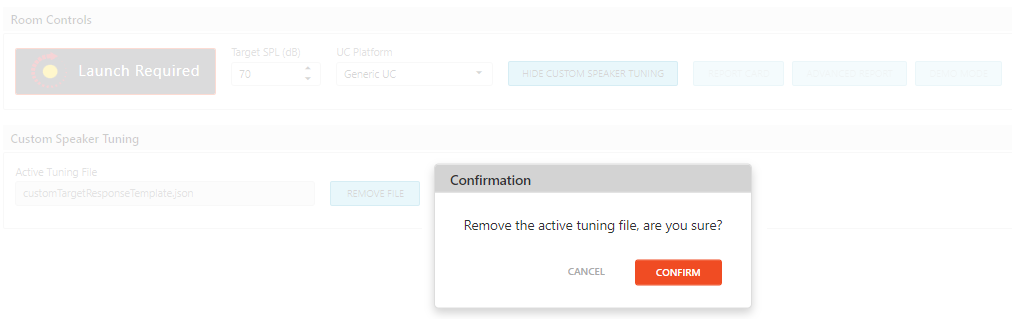
If the Active Tuning File field is left empty the default Launch target will be used, or you may select and apply another JSON file.
Run Launch again using the Launch Required button to apply the new tuning.
JSON template
Frequencies are adjustable from 20 to 20,000, bandwidth is adjustable from 0.1 to 4.0, gain is adjustable -30 to +15, same as the defaults for our parametric EQ block. A 12-channel Uber filter in Tesira software can be used to visualize the settings in the JSON file, using 2nd order Butterworth filters for the lower and upper corner settings. The Transfer Function block allows easy comparison of different filters.
{

    "lowerCorner":80.0,

    "upperCorner":16000.0,

    "parametricEQs":

    [

        {

        "freq": 500.0,

        "gain": 0.0,

        "bandwidth": 0.5

        },

        {

        "freq": 500.0,

        "gain": 0.0,

        "bandwidth": 0.5

        },

        {

        "freq": 500.0,

        "gain": 0.0,

        "bandwidth": 0.5

        },

        {

        "freq": 500.0,

        "gain": 0.0,

        "bandwidth": 0.5

        },

        {

        "freq": 500.0,

        "gain": 0.0,

        "bandwidth": 0.5

        },

        {

        "freq": 500.0,

        "gain": 0.0,

        "bandwidth": 0.5

        },

        {

        "freq": 500.0,

        "gain": 0.0,

        "bandwidth": 0.5

        },

        {

        "freq": 500.0,

        "gain": 0.0,

        "bandwidth": 0.5

        },

        {

        "freq": 500.0,

        "gain": 0.0,

        "bandwidth": 0.5

        },

        {

        "freq": 500.0,

        "gain": 0.0,

        "bandwidth": 0.5

        }

    ]

}
Sample JSON files
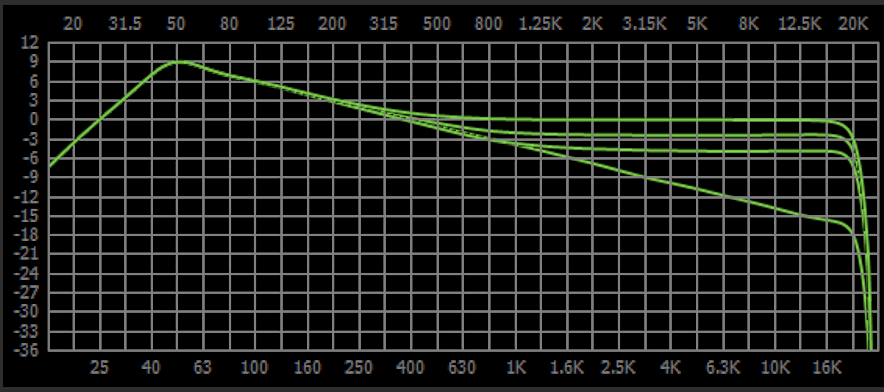
These files are for test purposes and will allow you to hear the effect of different tunings when using Biamp Launch. They are not necessarily appropriate tuning targets for conference room systems. The graphs at right are a visualization of the target responses.
 Constant -3dB per octave slope from 50Hz to 20kHz
Constant -3dB per octave slope from 50Hz to 800Hz, then flat to 20kHz
Constant -3dB per octave slope from 50Hz to 1kHz, then flat to 20kHz
Constant -3dB per octave slope from 50Hz to 3kHz, then flat to 20kHz
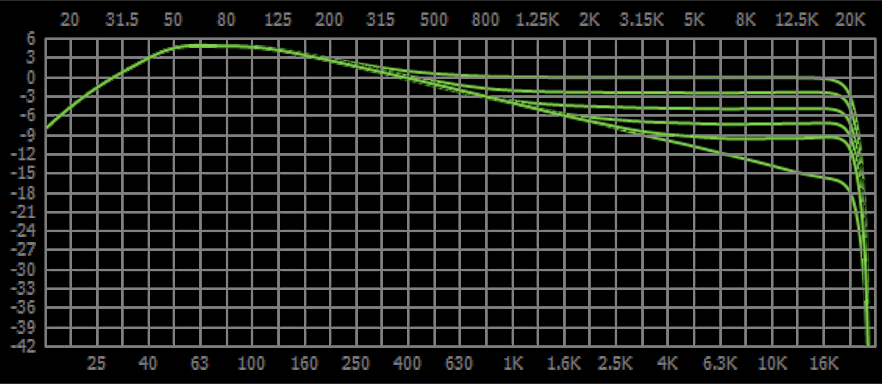 Plateau from 50Hz to 100Hz, constant -3dB per octave slope from 100Hz to 20kHz
Plateau from 50Hz to 100Hz, constant -3dB per octave slope from 100Hz to 800Hz, then flat to 20kHz.
Plateau from 50Hz to 100Hz, constant -3dB per octave slope from 100Hz to 1kHz, then flat to 20kHz.
Plateau from 50Hz to 100Hz, constant -3dB per octave slope from 100Hz to 3kHz, then flat to 20kHz.
Plateau from 50Hz to 100Hz, constant -3dB per octave slope from 100Hz to 5kHz, then flat to 20kHz.
Plateau from 50Hz to 100Hz, constant -3dB per octave slope from 100Hz to 8kHz, then flat to 20kHz.
An empty template file shows a flat output: customTargetResponseTemplate.json