Measuring and optimizing WiFi networks for Modena
Real time Full HD video streaming over the WiFi requires a good connection to the WiFi infrastructure with good and stable WiFi signal strength and enough bandwidth to support Full HD streaming. This document is intended to guide network administrators and IT teams in measuring the quality of the WiFi connection between user devices and the Modena Hub.
Introduction
We need to turn qualitative requirements into quantitative requirements, and see how to check if the existing WiFi network matches the needs of a Modena system.
The test must be performed with the real data path in mind:
- From user devices to the Modena Hub through corporate APs, if Modena Hub is connected to the corporate network using the ethernet interface and users connect to the corporate APs.
- From user devices to the Modena Hub+ integrated AP, if users connect directly to the Modena Hub+, for example in case of Guests users.
IMPORTANT:
A network test provides a snapshot of network conditions at a given time. We recommend to repeat the test at regular intervals and with different network workload.
Wireless requirements
Refer to the Modena Network Administrator’s Guide for the Modena overall requirements and specific Wifi requirements.
The wireless requirements are expressed through three values:
- Bandwidth: the connection speed between the AP and the user device. The minimum stable bandwidth requirements for a Modena session are:
- 4 Mbps average / 15 Mbps peak per connected client (upstream when presenting; downstream when receiving).
- Additional 4 Mbps average / 15 Mbps peak for the videoconference host when using the Wireless USB feature.
- RSSI: "Received Signal Strength Indicator" is the power of the signal received on the user device from the access point.
RSSI should be stable above -65dBm, recommended above -60dBm for real time audio video streaming.
- SNR: "Signal to Noise Ratio" is the difference between the RSSI and the noise level measured on the user device.
It indicates the "intelligibility" of the message and is used to negotiate the uplink speed between the AP and the user device. The higher the SNR, the faster the connection speed. Devices constantly adjust their data rates to help the receiving device on the other end understand them. When devices are far away from each other, or if there is a lot of background noise, they’ll fall back to slower and slower data rates.
For example, if RSSI is -60dBm and Noise is -95dBM, the SNR is (-60dBm) - (-95dBm) = 35dB
SNR should be stable above 25dB, recommended above 35dB for real time audio video streaming.
Ping Test
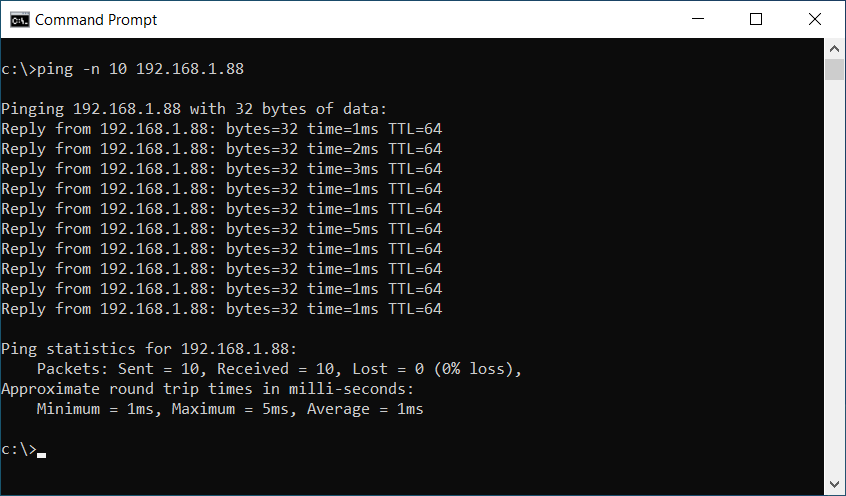
Ping is a network administration utility used to test the reachability of a host on an Internet Protocol (IP) network and is available for all operating systems.
Ping measures the round-trip time for messages sent from the originating host to a destination computer that are echoed back to the source and gives the the reaction time of your connection–how quickly your device gets a response after you've sent out a request. A fast ping means a more responsive connection, especially in applications where timing is everything (like real time streaming). Ping is measured in milliseconds (ms).
Ping operates by sending Internet Control Message Protocol (ICMP) echo request packets to the target host and waiting for an ICMP echo reply.
The program reports errors, packet loss, and a statistical summary of the results, typically including the minimum, maximum, the mean round-trip times, and standard deviation of the mean.
A reasonable Ping measure between the user device and the Modena Hub should reside within few milliseconds to be within the average latency of a common LAN.
Channels and channel bonding
WiFi signals are transmitted on different frequency ranges called channels. In the 2.4 GHz band, we have 11 or 14 channels (depending on local regulations). Unfortunately, most of the channels partially overlap. Putting two networks on partially overlapping channels will result in interference, so the recommended solution is to use the three non-overlapping channels: 1, 6, and 11. The 5 GHz band has up to 25 non-overlapping channels available, depending on local regulations. For this reason and because of the higher throughput available, 5GHz is preferable over the 2.4GHz band and is required when using Modena Hub.
Channel width varies depending on the wireless standard being used. Channel Bonding in 802.11n and 802.11ac allows multiple 20 MHz channels to be combined to make a 40 MHz channel. This offered more throughput, just like a 4-lane highway accommodates more traffic than two lanes.
802.11ac expanded on this concept by offering 40, 80, and even 160 MHz channels via channel bonding. For a Modena Hub WiFi infrastructure, it’s best to start with 40 MHz channels.
Measuring bandwidth
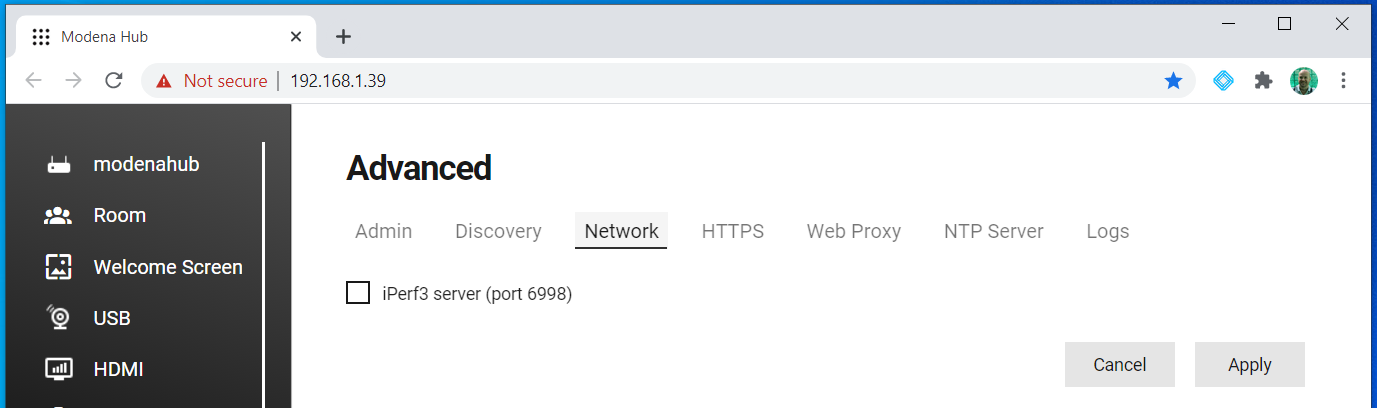
Using an appropriate tool to measure network performance is highly recommended. Modena Hub has an iPerf3 server implementation onboard that can be launched from the Advanced section of the web admin (see below). iPerf3 is a widely used, cross-platform tool that can produce standardized performance measurements for any network, with free clients available for all major platforms.
Step 1: download the iPerf client
Windows / MacOS: download the open source command line tool iPerf3 from the iPerf website.
Android / iOS: use a compatible iPerf3 tool. There are many possibilities and one option is the free HE.net Network Tools.
Please note that all tests should be performed by selecting iPerf version 3 where needed.
Step 2: enable the iPerf server
On the Modena Hub, enable the iPerf3 server and note the port to be used for the test (default 6998).
See Modena advanced configuration for more information.
Step 3: perform the test
Open a system terminal (Windows and MacOS) or start the iPerf3 command line tool (Android and iOS), and execute the test with this parameters:
Windows
Client --> server test:
iperf3 -c servername -p portnumber
(Example: iperf3 -c 192.168.1.39 -p 6998)
Server --> client test
iperf3 -c servername -p portnumber -R
(Example: iperf3 -c 192.168.1.39 -p 6998 -R)
MacOS
Client --> server test:
./iperf3 -c servername -p portnumber
(Example:./iperf3 -c 192.168.1.39 -p 6998)
Server --> client test
./iperf3 -c servername -p portnumber -R
(Example:./iperf3 -c 192.168.1.39 -p 6998 -R)
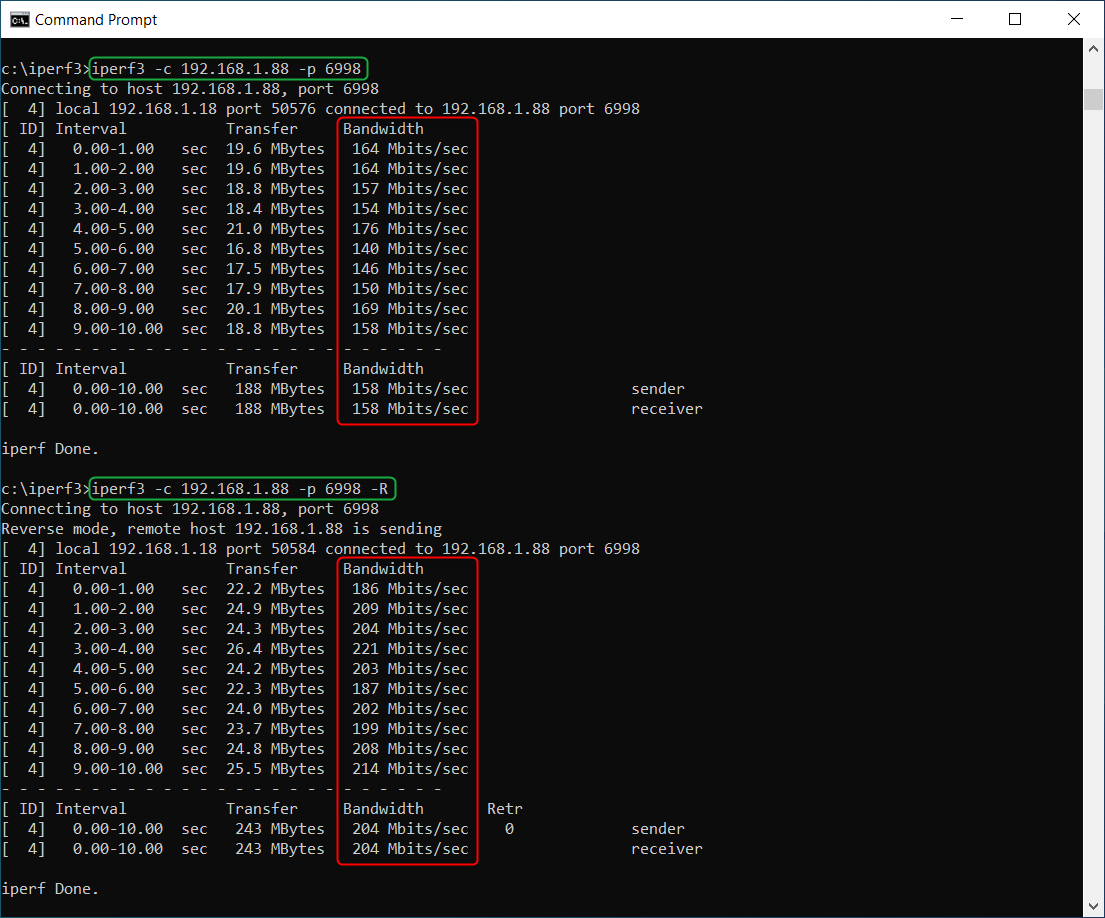
Check if the bandwidth value is stable and within the Modena Hub boundaries as indicated above.
Measuring RSSI and SNR
Check if the RSSI (Signal Strength) and SNR (Signal to Noise) values are stable and within the Modena Hub boundaries as indicated above.
Windows
Use a tool for measuring the WiFi signal strength on the user device. There are many tools available, one option is Acrylic Wi-Fi. Install and run the program and check if the RSSI value is stable and within the Modena Hub boundaries.
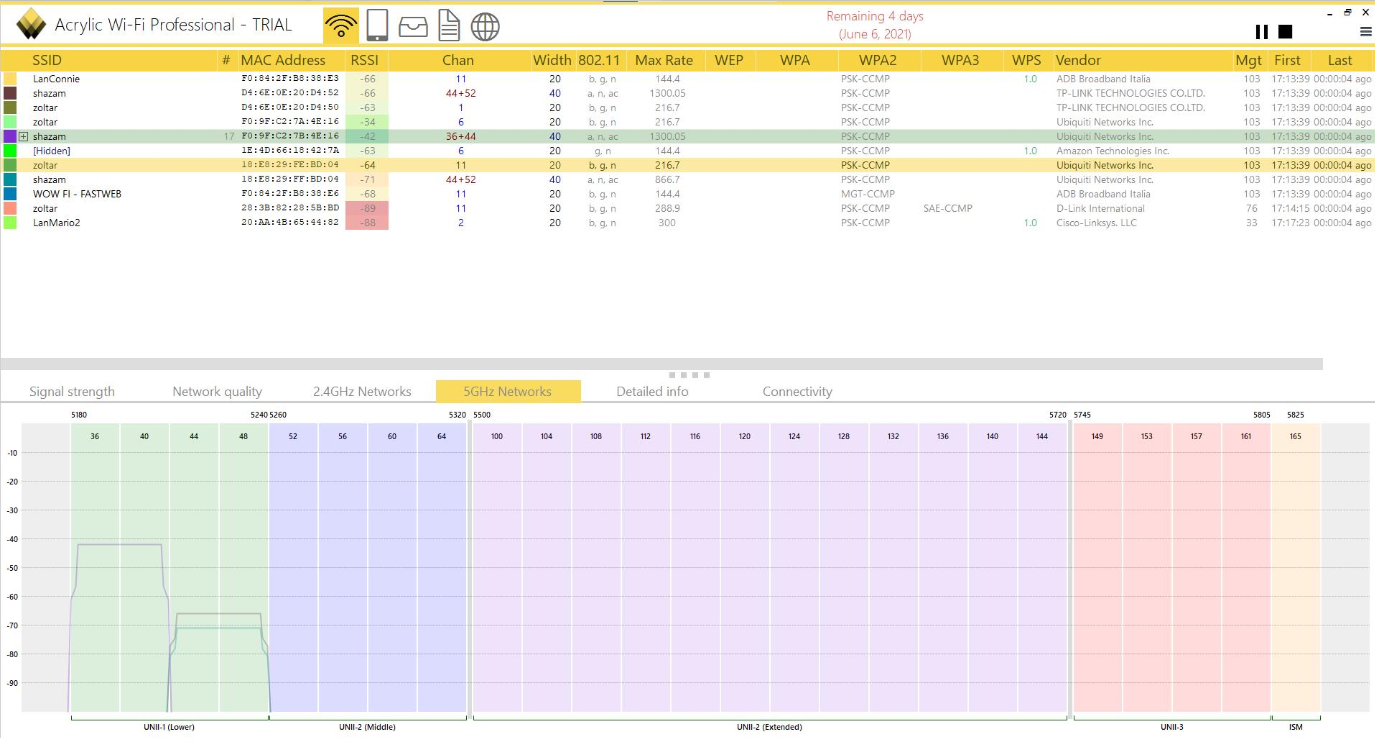
On Windows 10, the SNR value must be measured with a professional tool and an external WiFi antenna configured in monitor mode. When such a tool is not available, a good approximation for the average noise level in a typical office environment is -95dBm.
MacOS
Press the Option button and click on the WiFi icon in the status bar (top right). On the drop down menu, select the Wireless Diagnostic entry and, as soon as the window appears, select the Scan entry in the WiFi Diagnostic Window menu.

The Scan utility on MacOS shows information about the quality of the WiFi connection including the RSSI value and the noise. From this data the SNR can be easily calculated.
Android
Use a tool for measuring the WiFi signal strength on the user device. There are many possibilities and one option is the free VREM WiFi Analyzer.

On Android, the SNR value must be measured with a professional tool and an external WiFi antenna. When such a tool is not available, a good approximation for the average noise level in a typical office environment is -95dBm.
iOS
Install the Airport utility from Apple.
In the iOS configuration, select the Utility Airport App and enable the WiFi analysis.
Execute the Utility Airport, select WiFi analysis.

On iOS, the SNR value must be measured with a professional tool and an external WiFi antenna. When such a tool is not available, a good approximation for the average noise level in a typical office environment is -95dBm.